
01
Why this, why now
Every argument in this dossier is decades old. The reason to read it this year is that several of the curves it describes are crossing thresholds at the same time, and the crossing has a calendar.
A doubling curve spends most of its life looking harmless. Then it spends about two years looking dramatic, and by the time it looks dramatic the cheap moves have been made by someone else. The evidence in the sections that follow says the dramatic stretch for AI is roughly now through 2028: capability benchmarks crossed the expert line in 2025, the cost of a fixed capability is falling about tenfold a year, the machines can now hold a task for most of a working day, and the physical build-out behind all of it is under construction on published schedules. None of that requires believing anyone's marketing. It only requires reading curves that are already public.
- Nov 2022 — ChatGPT launches. Its level of output quality costs about 20 dollars per million tokens.
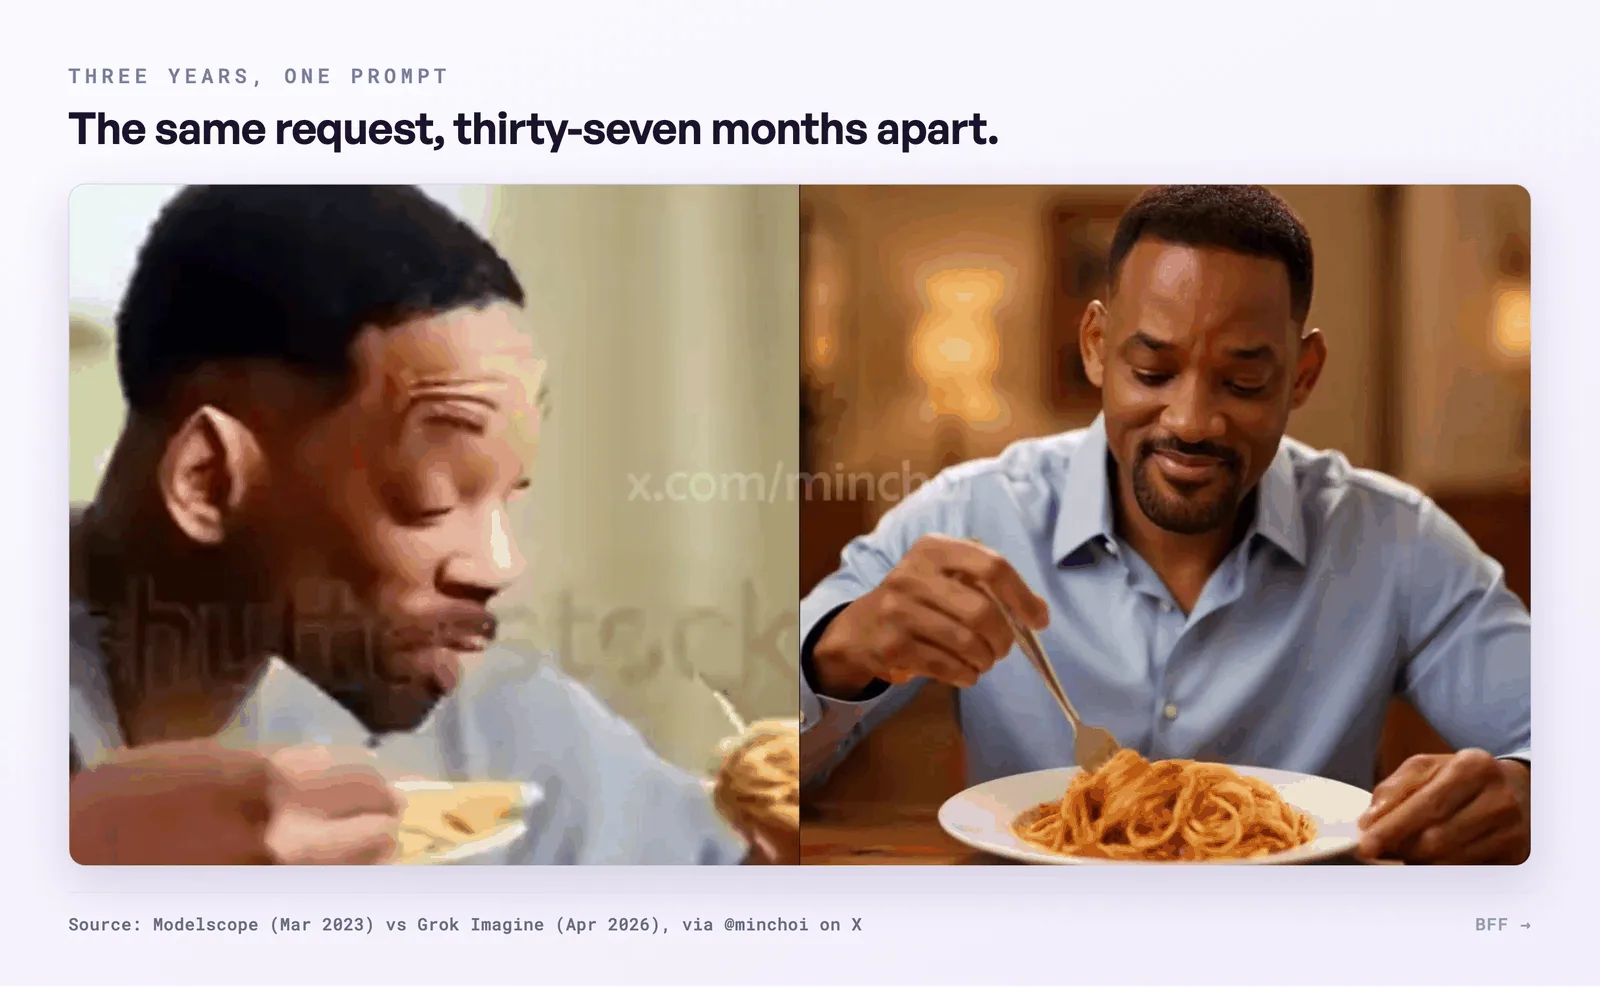
- Mar 2023 — An AI video of Will Smith eating spaghetti becomes the internet's shorthand for "AI can't do video."
- Jun 2023 — GPT-4 scores 30 percent on the hardest science benchmark, far below human experts.
- Apr 2025 — o3 scores 87.7 percent on the same benchmark, clearly above PhD experts. ChatGPT approaches a billion weekly users.
- Aug 2025 — The EU AI Act's obligations for general-purpose models take effect. The rulebook now has dates.
- Apr 2026 — The same spaghetti prompt renders photoreal. Microsoft AI's chief projects another ~1,000x of effective compute by end-2028. A single AI campus now draws more power than Amsterdam.
02
1. Thirty steps
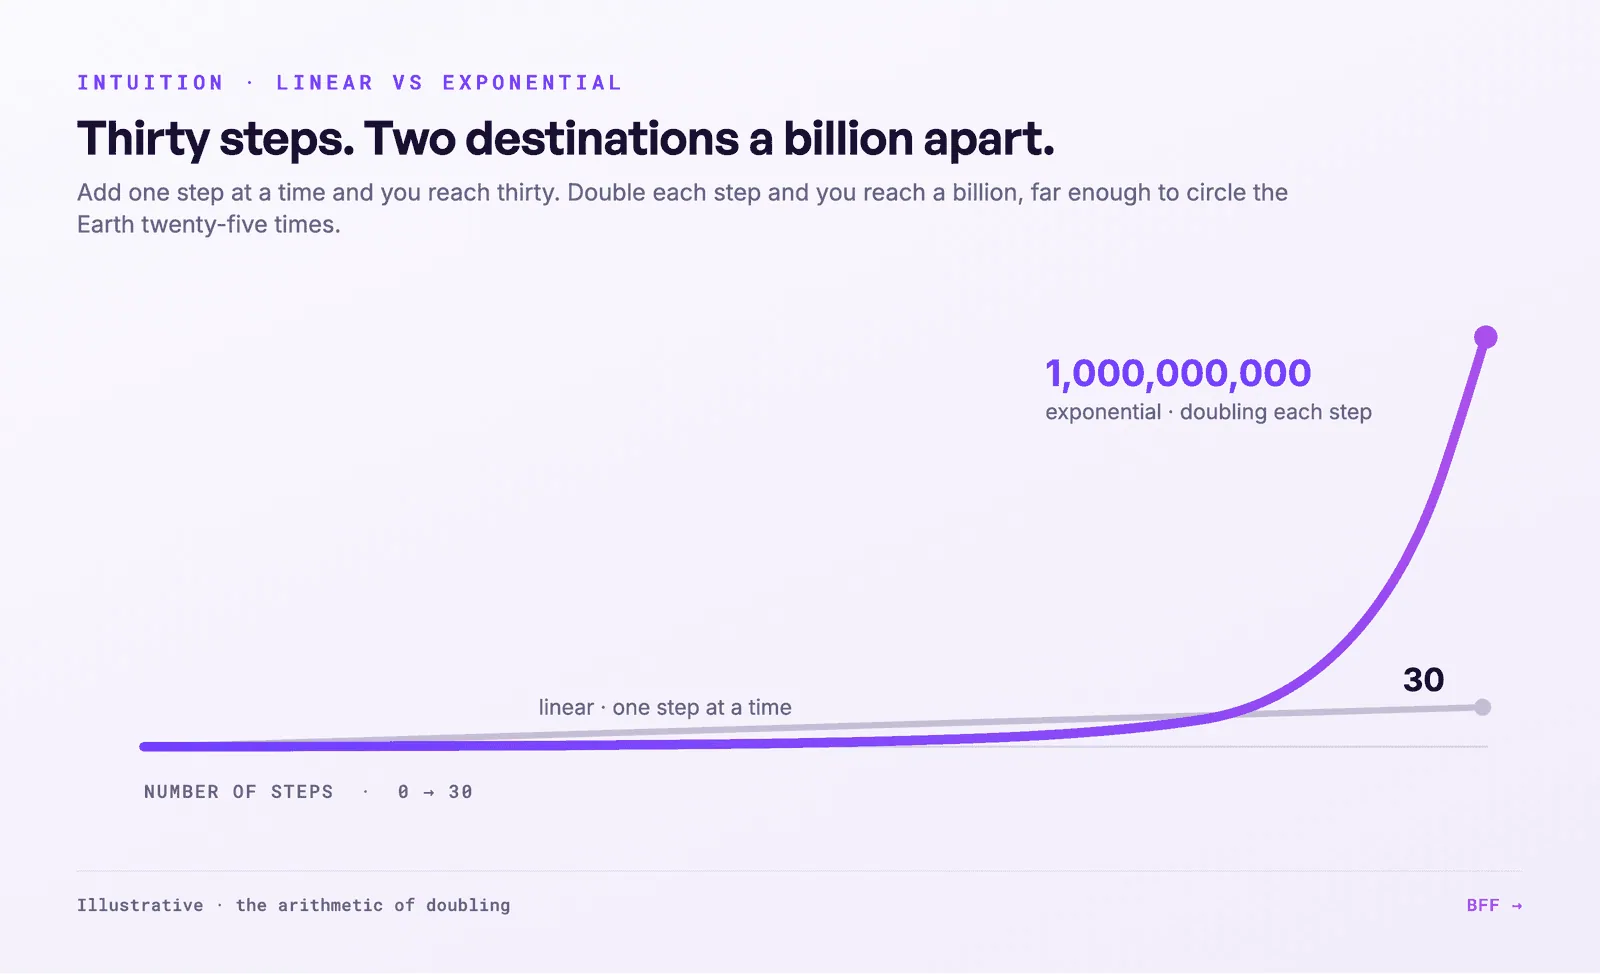
Take thirty steps across a room and you travel about thirty metres. Take thirty exponential steps, doubling each time, and you travel a billion. That gap, between thirty and a billion, is the gap between how we think and how technology moves.
A billion metres is far enough to circle the Earth about twenty-five times. Same thirty steps. The only difference is whether each one adds or multiplies. Our intuition runs on adding, because for almost all of human history that was the correct model. Two apple trees gave about twice the apples of one. Walking half as far took half as long. The world was local and linear, and a brain tuned to linear extrapolation was a brain that survived.
The difference between the two rules is easy to underrate on paper and impossible to miss on a chart. The figure below plots both from the same starting point, thirty steps added and thirty steps doubled. For the first stretch they sit almost on top of each other, which is exactly the trap. Then the doubling line leaves the frame, and the added line looks like it never left the floor.
Technology broke the linear model and our intuition has not caught up. The classic illustration is the chessboard: place one grain of rice on the first square and double it on each of the sixty-four. The first half of the board holds about four billion grains, a large field's worth, and it feels manageable. The second half does not, because the final square alone carries more than nine quintillion grains and the full board holds more grain than the world grows in over a thousand years. Ray Kurzweil named the moment it turns the second half of the chessboard. Nothing about the rule changed. Only our ability to feel where it was heading.
Or fold a sheet of paper. A single sheet is a tenth of a millimetre thick, and fold it forty-two times, doubling with each fold, and the stack would reach the Moon. You cannot actually fold paper forty-two times, which is part of the point: the arithmetic of doubling produces numbers the physical imagination refuses to hold.
03
2. Why the intuition fails
This is not a figure of speech. The underestimation of exponential growth is a measured, replicated cognitive bias, and it resists both education and experience.
In 1975, the psychologists Willem Wagenaar and Sabato Sagaria ran the first careful experiments. They showed people the early part of an exponential curve and asked them to extend it, and people did not just miss, they missed enormously, with two-thirds of subjects commonly guessing below a tenth of the true value. The unsettling part came next: telling people in advance that the growth was exponential did not fix it, and neither did daily familiarity with things that grow. The bias sat underneath instruction and experience both.
Economists later gave it a name and a price tag. Victor Stango and Jonathan Zinman, writing in the Journal of Finance in 2009, defined exponential growth bias as the tendency to treat exponential curves as if they were straight lines, and showed it costs real money, since more biased households borrow more and save less and misjudge what compound interest will do to them over time. The same wiring that makes a doubling technology feel slower than it is makes a credit card feel cheaper than it is.
There is a clean reason for it in how perception works. Our senses are logarithmic. We register the ratio between two quantities far better than the absolute gap, which is why a candle is dramatic in a dark room and invisible in daylight. Logarithmic senses are the opposite of what you need to feel an exponential coming, so the curve reads as gentle right up until it is vertical.
04
3. The oldest curve we know
The most famous exponential in technology is Moore's Law, and its real lesson is not about transistors. It is that the curve outlives every single technology that carries it.
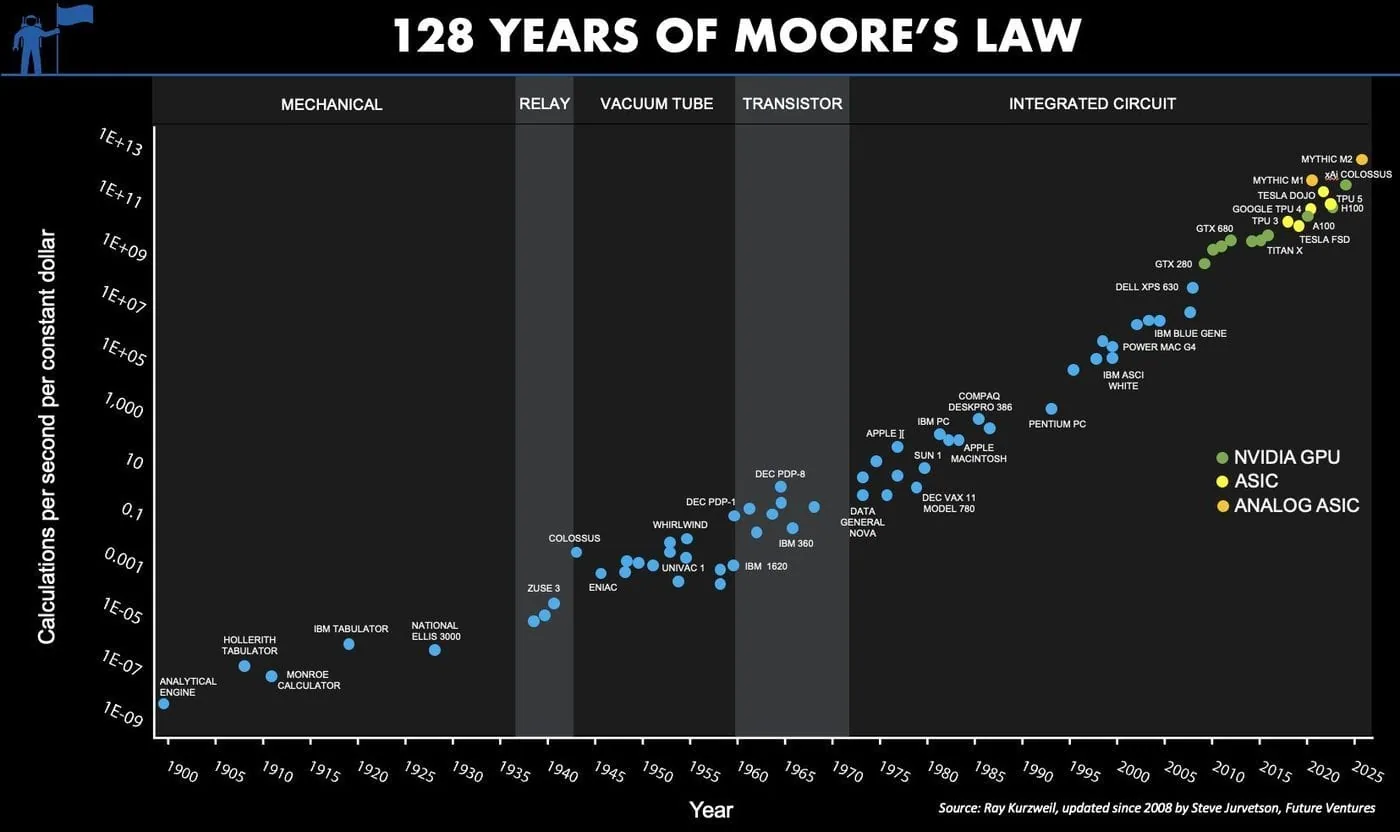
Gordon Moore observed in 1965 that the number of components on a chip was doubling on a regular cadence, and revised it to roughly every two years in 1975. The prediction has held with almost eerie precision. A 1971 Intel chip held about 2,300 transistors and a 2021 processor held 58 billion, and measured across fifty years the doubling time works out to 2.03 years, within days of Moore's own number. Few forecasts in any field have survived half a century that well.
People announce its death regularly and they are half right. Classic transistor scaling has genuinely slowed, and even Intel concedes the cadence has stretched. But the interesting version of Moore's Law was never about transistors. When Steve Jurvetson plotted computing power per dollar back to 1900, the line ran smooth across five completely different technologies: mechanical calculators, relays, vacuum tubes, transistors, integrated circuits. Each one rose and flattened in turn and the baton passed to the next. The exponential predates Moore by decades and has already survived the death of four of the five technologies that carried it. Lately the baton has passed from the general-purpose chip to the specialised AI processor.
The same shape shows up wherever a technology gets a learning curve. Solar panels fell from about 77 dollars per watt in the late 1970s to well under a dollar today, a decline of more than 99 percent, dropping roughly a fifth in price with every doubling of volume produced. Lithium battery packs fell 93 percent in fifteen years. The cost to sequence a human genome fell from about 95 million dollars in 2001 to a few hundred, and after 2008 it fell faster than Moore's Law rather than slower. These are not three stories. They are the same story told in silicon, in solar cells and in DNA, and section six puts all three on the same axis.
05
4. The exponentials running right now
The reason this stopped being an abstract argument is artificial intelligence, where several exponentials are stacked on top of each other at once.
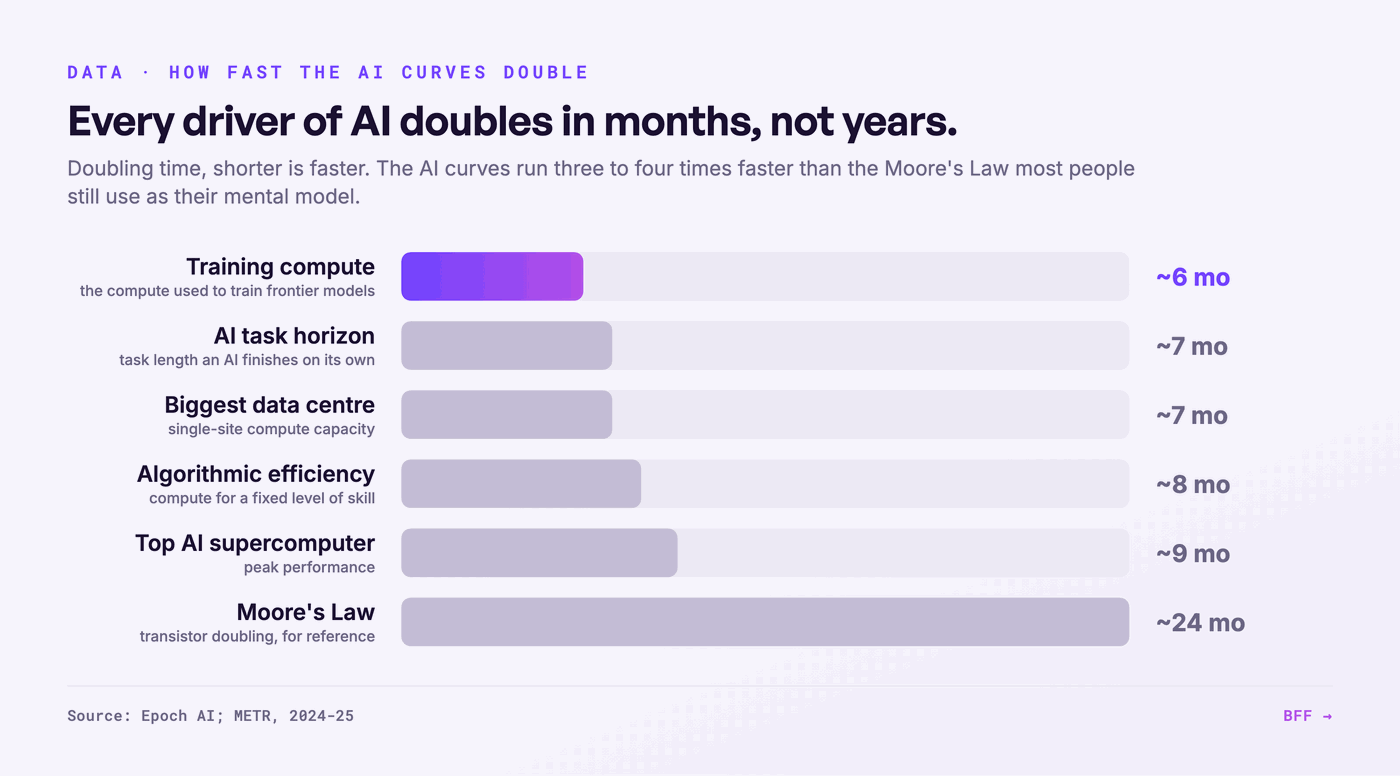
The research group Epoch AI tracks these carefully, and the numbers are steeper than most people realise. The computing power used to train frontier AI models has been growing four to five times a year, which means it doubles roughly every six months, far faster than Moore's Law ever ran. Underneath that, three other curves compound: the hardware gets more capable, the algorithms get more efficient, and the same result gets cheaper to produce.
| What is growing | Doubling time | Source |
|---|---|---|
| Training compute for frontier models | ~6 months | Epoch AI (2024) |
| Performance of the top AI supercomputer | ~9 months | Epoch AI (2025) |
| Algorithmic efficiency (compute for a fixed skill) | halves every ~8 months | Epoch AI (2024) |
| Length of task an AI can complete on its own | ~7 months | METR (2025) |
| Cost of a given level of AI capability | falls ~10x per year | a16z, Stanford AI Index |
Those doubling times are worth seeing next to the old benchmark. The chart below sets today's AI curves against Moore's two-year cadence. Moore's Law was the fastest sustained exponential most people had ever heard of, and on this chart it is the slow line at the bottom.
What a tripled doubling looks like
Numbers in a table stay polite. The same curve, seen through one repeated request, does not. In March 2023 the state of the art in AI video was a smeared, melting clip of Will Smith eating spaghetti, and it was a joke with its own meme page. In April 2026 the same prompt renders in photoreal detail, and the reflex of the average viewer has flipped from obviously fake to probably real. Thirty-seven months.
Capability, measured
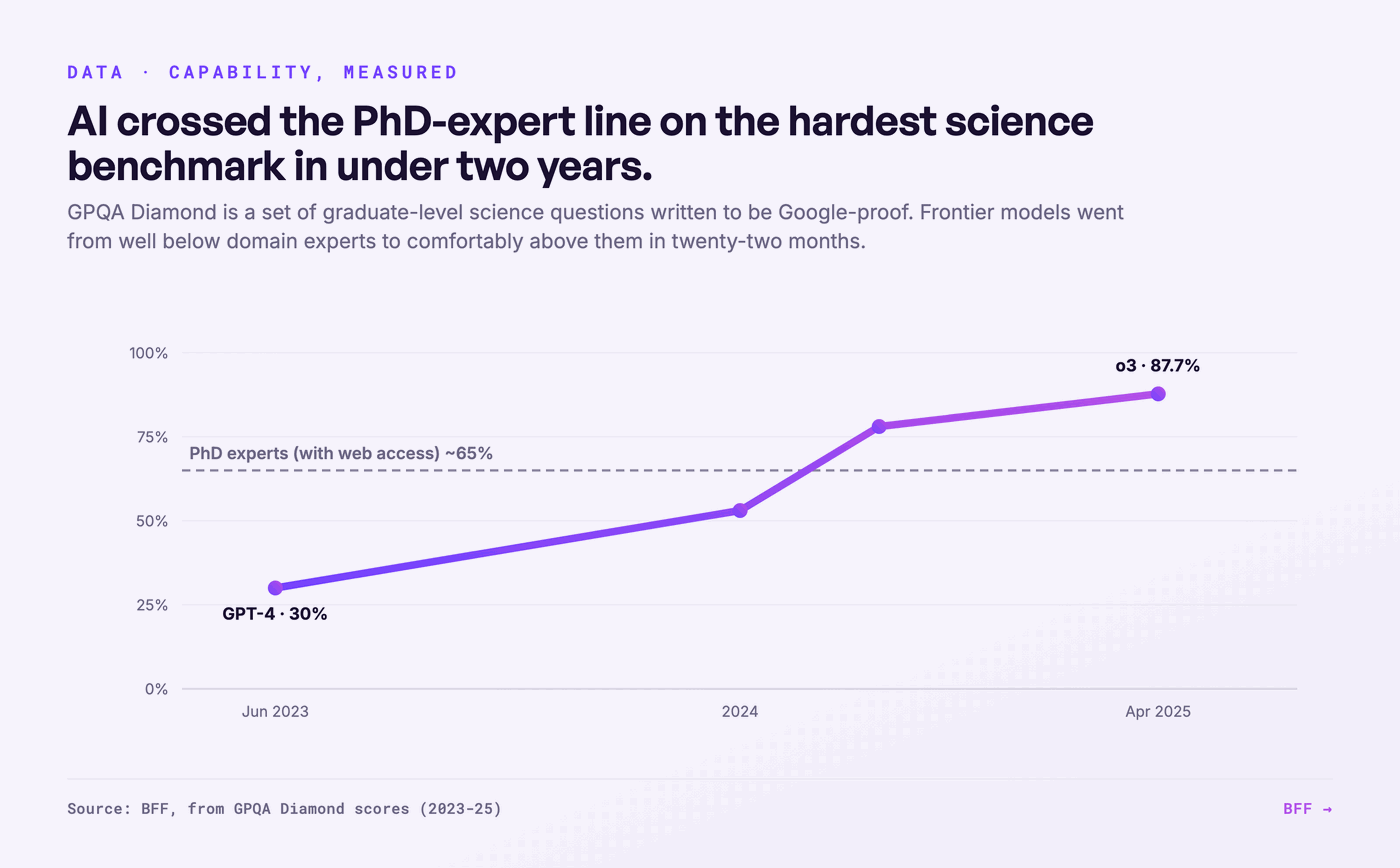
Party tricks can mislead, so use the hardest measure available. GPQA Diamond is a benchmark of graduate-level science questions written specifically to be search-proof, and PhD experts in the relevant field, with full web access, score around 65 percent. GPT-4 managed 30 percent in mid-2023. By April 2025, o3 scored 87.7 percent. The line crossed the human-expert level somewhere in late 2024 and did not slow down to celebrate.
Intelligence, repriced
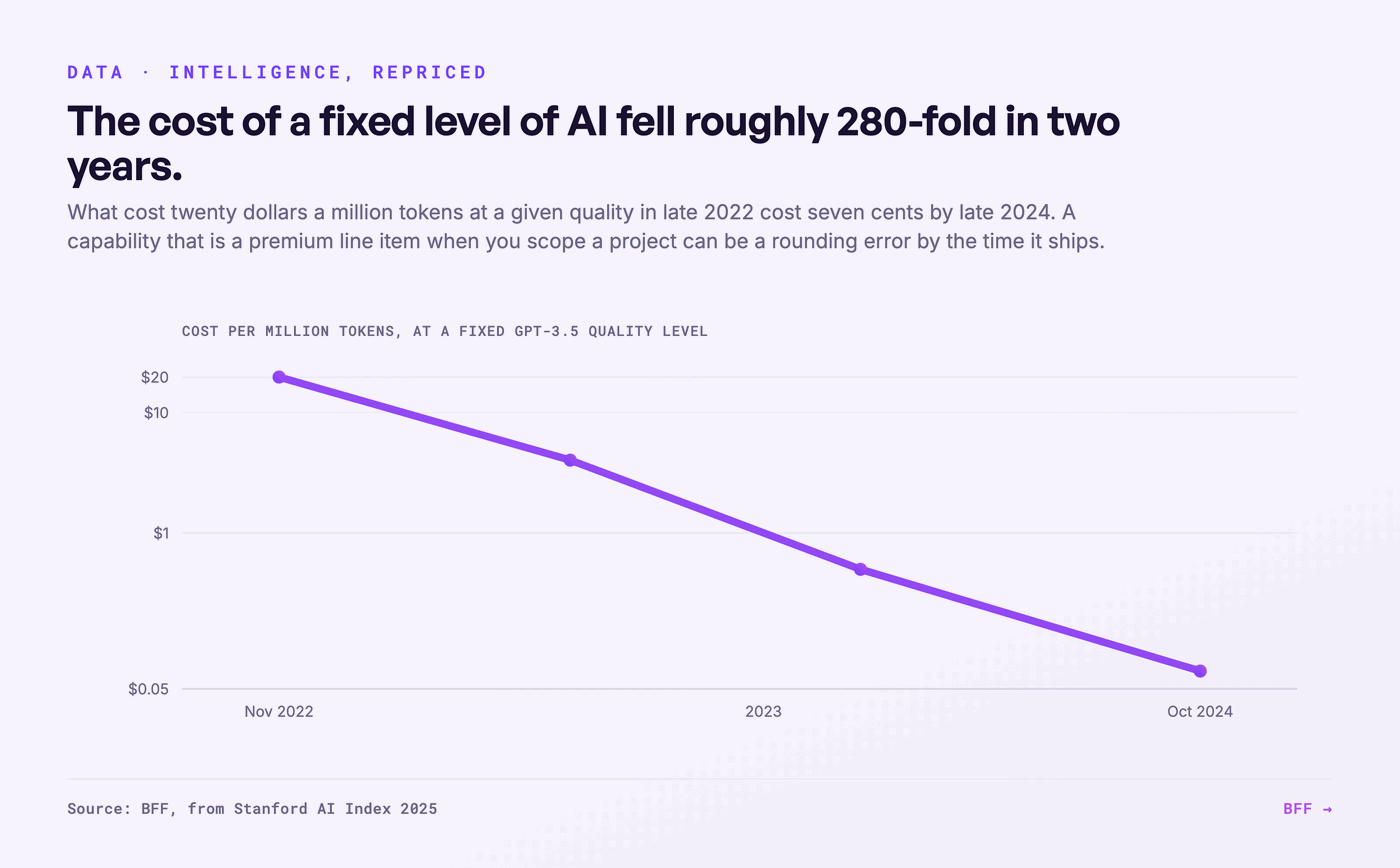
The price curve is the one businesses feel first. The cost of a fixed level of AI capability has been falling roughly tenfold a year: what cost twenty dollars per million tokens at ChatGPT quality in late 2022 cost about seven cents by late 2024, a collapse of more than 280-fold in two years. That multiple depends on which quality level you anchor to, and other anchors give different numbers in the same direction, so read the order of magnitude rather than the decimal. A capability that is a premium line item on the day you scope a project is a rounding error by the time it ships, and budgets anchored to last year's price list are wrong in the direction that causes underinvestment.
06
5. The doubling that is itself doubling
One curve deserves its own section, because it measures the thing that actually changes work: how long a machine can carry a task without a human. That horizon is doubling, and lately the doubling itself has been speeding up.
The research group METR measures the length of task, in human time, that an AI agent can finish on its own at a 50 percent success rate. In 2019 the answer was a couple of seconds. By early 2025 it was about an hour. By 2026 it is around sixteen hours, most of a working day, and the doubling time across the whole period is roughly seven months. Read that against your own workflows: every seven months, the chunk of work you can hand over whole roughly doubles in size.
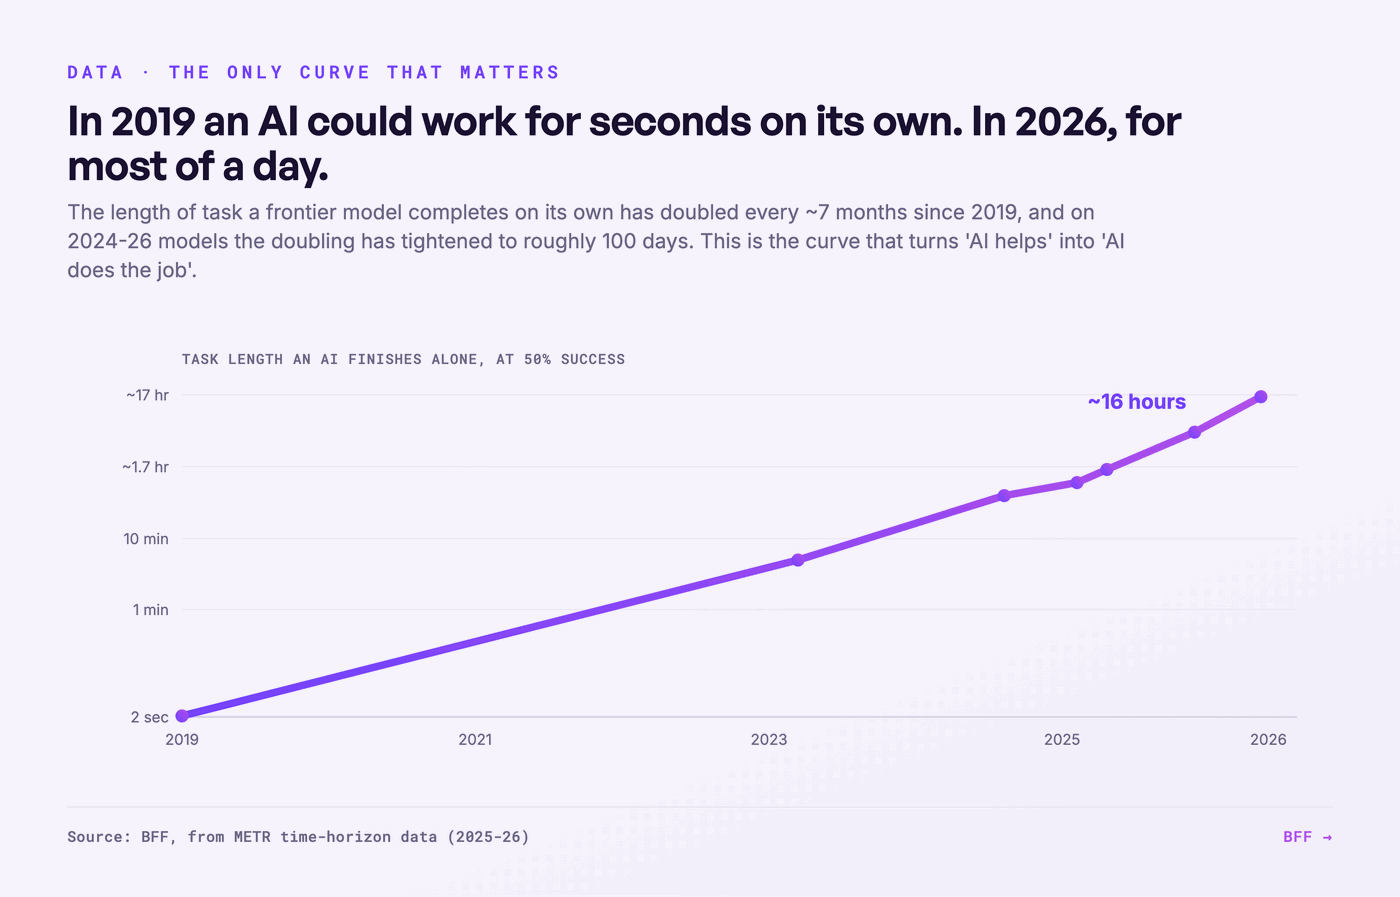
The second layer is stranger. On the models released in 2024 through 2026, METR's measured doubling time tightened from about seven months to roughly one hundred days. A curve whose doubling time shrinks is called superexponential, and it shows up elsewhere too, since Epoch AI finds the computing capacity of the largest single data centre has doubled every seven months since August 2024. Mustafa Suleyman, who runs Microsoft AI, put the combined projection in writing in April 2026: on current build-out and efficiency trends, another thousand-fold increase in effective compute by the end of 2028.
I would hold that with both hands. A shrinking doubling time is precisely the kind of trend that cannot run for long, the tightened figure is recent enough that it could revert, and section eleven takes the limits seriously. Notice what the caution buys you though. Even if the pace relaxes back to seven months, the task horizon crosses from days into weeks within two years. The conservative reading of this chart is still the most disruptive labour-market claim of the decade.
07
6. Beyond compute: the same curve three times
It is tempting to file all of this under chips and assume it stays there. The pattern is bigger than silicon, and the same shape governs how we make electricity, how we store it, and how we read the genome.
Solar is the cleanest case. A solar module cost about 101 dollars per watt in 1976 and about 11 cents by 2024, a fall of more than 99.9 percent. The mechanism has a name, Swanson's Law: module prices drop roughly 20 to 23 percent for every doubling of cumulative capacity installed. It is not a time trend but a volume trend, which is why it kept going while pundits kept calling the top.
Batteries followed the same logic one decade behind. Lithium-ion pack prices fell from about 1,474 dollars per kilowatt-hour in 2010 to 108 dollars in 2025, down 93 percent, with stationary storage already at roughly 70 dollars. The pattern is not confined to energy either. Sequencing a human genome cost about 95 million dollars in 2001, roughly 1 million by 2008, and about 525 dollars by 2022, a fall of around five orders of magnitude. The turn matters: after next-generation sequencing arrived in January 2008, the cost curve steepened and outran Moore's Law rather than tracking it.
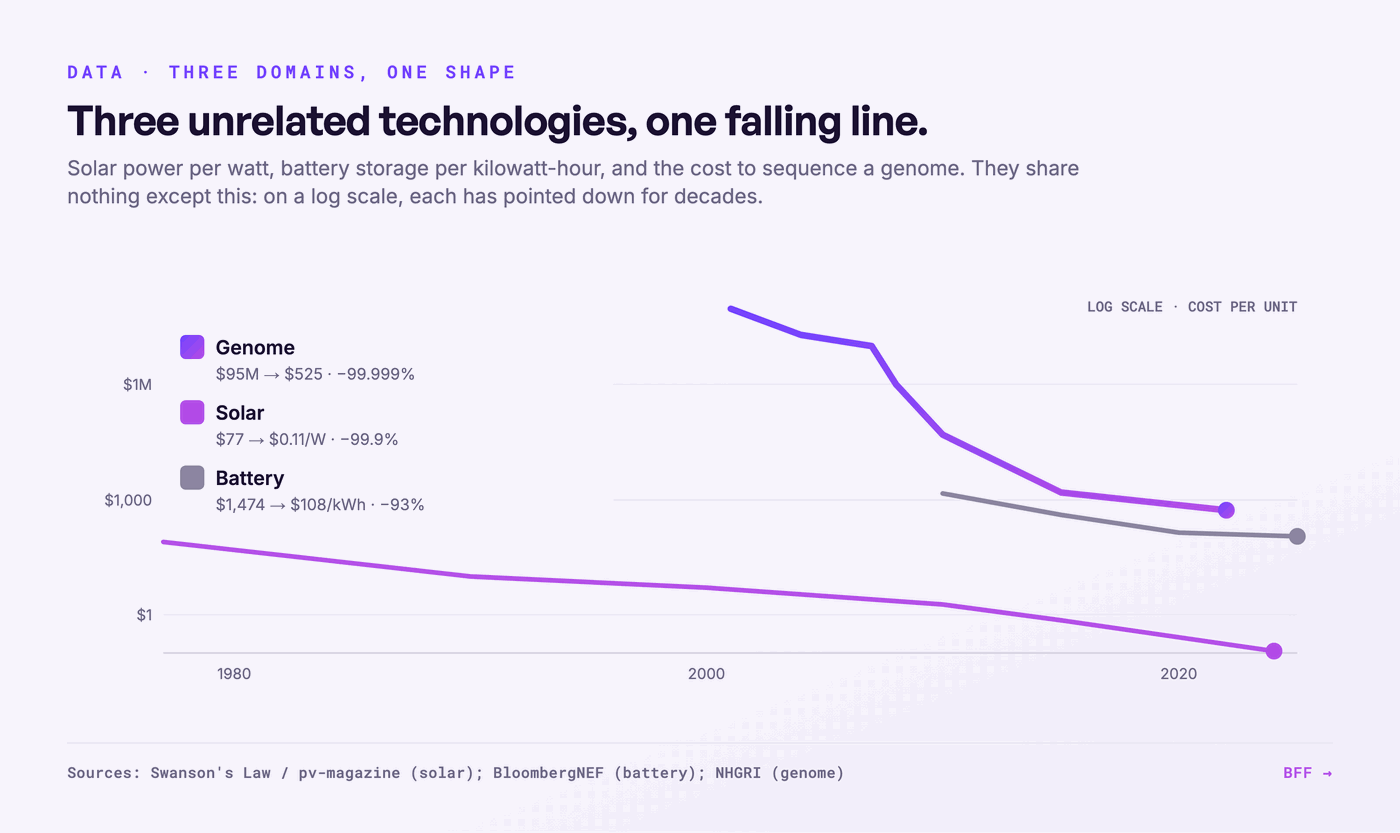
The rule underneath is Wright's Law, first observed in aircraft manufacturing in 1936: cost falls as a predictable function of cumulative production rather than of the calendar. That distinction is the whole point, because a time forecast off a Wright's Law curve will always undershoot when the driver is how much has been built and building accelerates. Swanson's Law is Wright's Law wearing a solar jacket. The same maths fits all three descents, which is why "it will slow down soon" has been wrong about all three for decades.
08
7. Convergence: when the curves multiply
A single exponential is impressive. Two exponentials feeding each other is where the genuine discontinuities live, the jumps that look like magic because no straight line ever pointed at them.
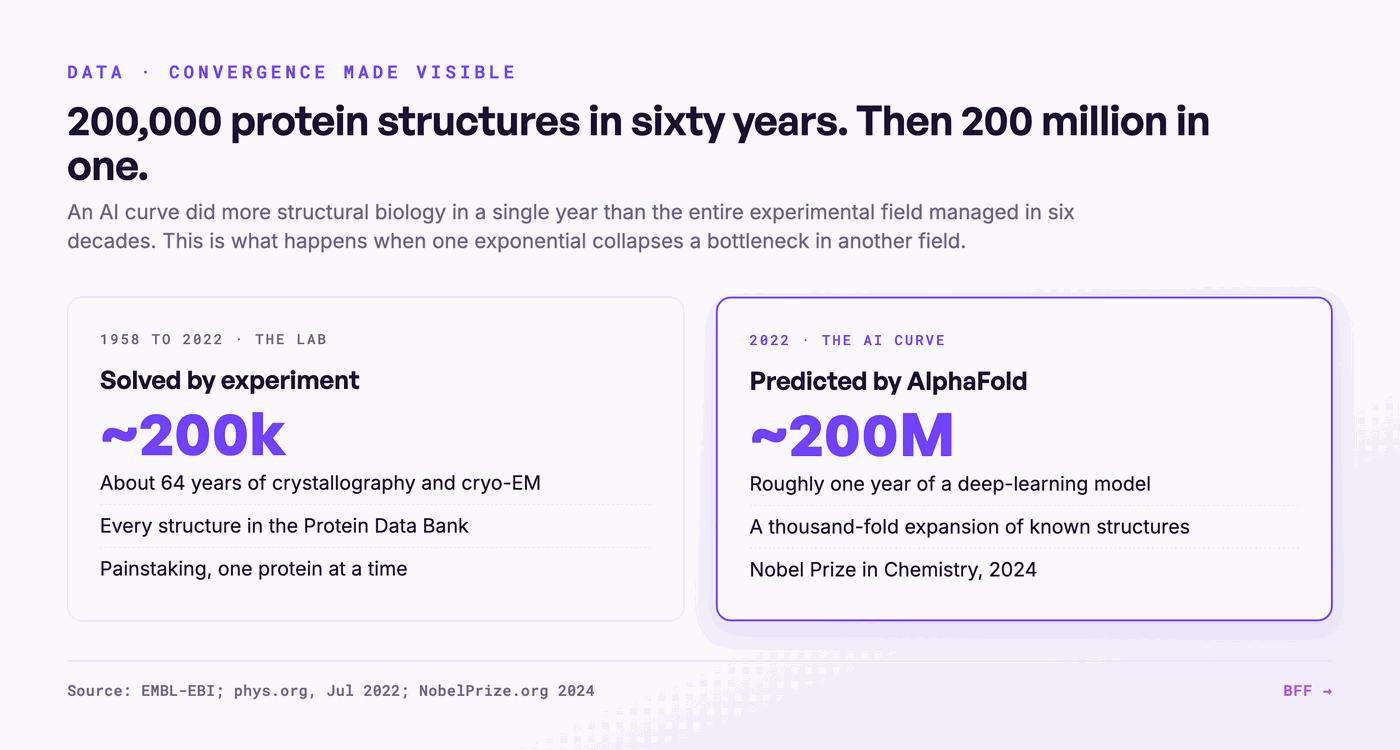
Protein folding is the clean example. For about sixty years biologists solved protein structures one at a time in the lab, and by 2022 they had resolved roughly 200,000 of them. Then an AI model met the problem, and DeepMind's AlphaFold predicted about 200 million structures in roughly a year, close to every protein known to science, a thousand-fold jump on six decades of experimental work. It won the 2024 Nobel Prize in Chemistry.
Drug discovery is bending the same way. Insilico Medicine took a disease target found by AI and a molecule designed by AI, rentosertib, from first hypothesis into a Phase IIa trial in roughly 30 months, against a typical timeline of about six years, at around a tenth of the usual cost (Nature Medicine, June 2025). One compressed timeline is an anecdote. A compressed timeline sitting on top of falling compute cost and rising model capability starts to look like a curve, though I would want several more before calling it one.
The curves also feed each other physically. Cheap energy is the fuel the compute curve runs on: solar is roughly 100 times cheaper than it was 50 years ago and batteries are down about 97 percent over 30 years, which is what makes ever-larger training runs affordable to power. The largest single-site data-centre compute has been doubling about every seven months since 2024, and the binding constraint on it now is electricity rather than chips. Robotics is the next curve lining up to converge, pulling cheap perception models into the physical world.
Compounding curves multiply rather than add, which is why the results overshoot every linear projection by so much. The honest version of the same point cuts the other way. Convergence is not a one-directional accelerant, and a bottleneck in any single curve, a shortage of training data or a shortage of power, can throttle all the ones stacked on top of it. The multiplication works in reverse too.
09
8. A short history of getting it wrong
The cost of the linear reflex is not theoretical. It is a long list of confident, specific, well-resourced forecasts that missed by orders of magnitude, always on the low side.
Before the misses, look at how quiet the start of a curve is. Bell Labs in 1989: a neural network called LeNet, built by Yann LeCun's team, reading handwritten digits off a screen. It could not paint or write or talk. It read numbers, slowly, and it was the frontier of the field. That model's direct descendants went on to process millions of bank cheques, and the technique it proved, learning from examples instead of rules, is the one running everything in section four. Thirty-seven years separate that footage from the photoreal video two sections back, and for the first twenty-five of those years the curve looked like nothing was happening.
In 1980, AT&T asked McKinsey to forecast how many Americans would carry a mobile phone by 2000. McKinsey studied it and returned a number: about 900,000. The actual figure was around 109 million, a miss of roughly 120 times. AT&T, having under-invested on that advice, later paid 12.6 billion dollars to buy its way back into the market it had been told was a niche. The forecast was not lazy. It was careful, and it was linear, and the technology was exponential. Worth noting the original study is not public and the figures are widely cited rather than primary, so I would treat the exact multiple as approximate and the lesson as solid.
Solar power has been misjudged the same way, year after year, by the people paid to model it. The International Energy Agency's annual outlook has for two decades acknowledged that solar grew, then drawn a nearly flat line forward from that year as if the growth were about to stop. It never did, and costs the agency projected for 2030 were hit around 2012, eighteen years early. Drawing a straight line off an exponential is the single most repeatable forecasting error of the last half century, and serious institutions still make it.
The pandemic turned the bias into a natural experiment on everyone at once. A 2020 study in the Proceedings of the National Academy of Sciences found people underestimated the virus's growth by about 46 percent, reading a curve that doubled every few days as if it were a gentle slope. The same paper found something hopeful: three sentences explaining the exponential raised people's estimates by 173 percent and increased their support for early action. The bias is deep, and it is correctable, and the correction is cheap.
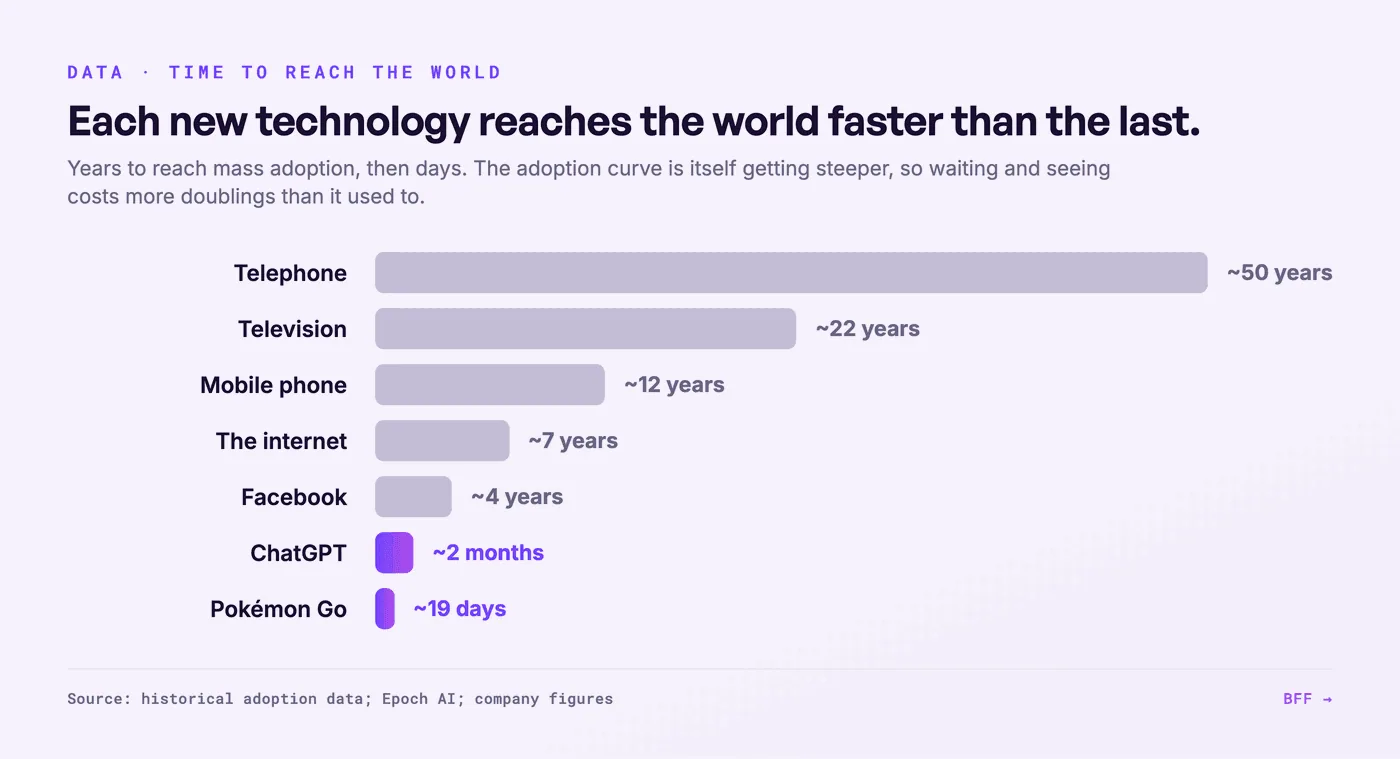
You can also watch the curve steepen in how fast new technologies find their audiences. The telephone took about fifty years to reach fifty million users, television twenty-two, the mobile phone twelve, the internet seven, Facebook four. Pokémon Go took nineteen days. Each new platform arrives on a steeper part of the same curve, and each time the people who planned for the last adoption speed were caught flat.
10
9. Eaten by the curve, and the price of waiting
Bad forecasts are one failure. Watching the curve arrive and still refusing to move is another, and it is the one that ends companies.
Kodak invented the digital camera in 1975. Its own engineer built the first one, and management chose to bury it rather than let it cannibalise the film business that was printing money. The film curve peaked, the digital curve took over, and Kodak filed for bankruptcy in January 2012, down from about 145,000 staff in the early 1980s to roughly 19,000. Blockbuster had a similar chance in 2000, when it was offered a small mail-order rival called Netflix for 50 million dollars and passed, judging it a niche. Netflix is now worth in the region of 230 billion dollars. Blockbuster is a nostalgia reference.
The structural reason is the same in both cases, and it is the bias from section two wearing a suit. Forecasts anchor to the visible flat part of the curve, the part that looks like a manageable side business, and by the time the steep part is obvious the incumbent is many doublings behind. The mistake feels prudent in the moment and is fatal in hindsight.
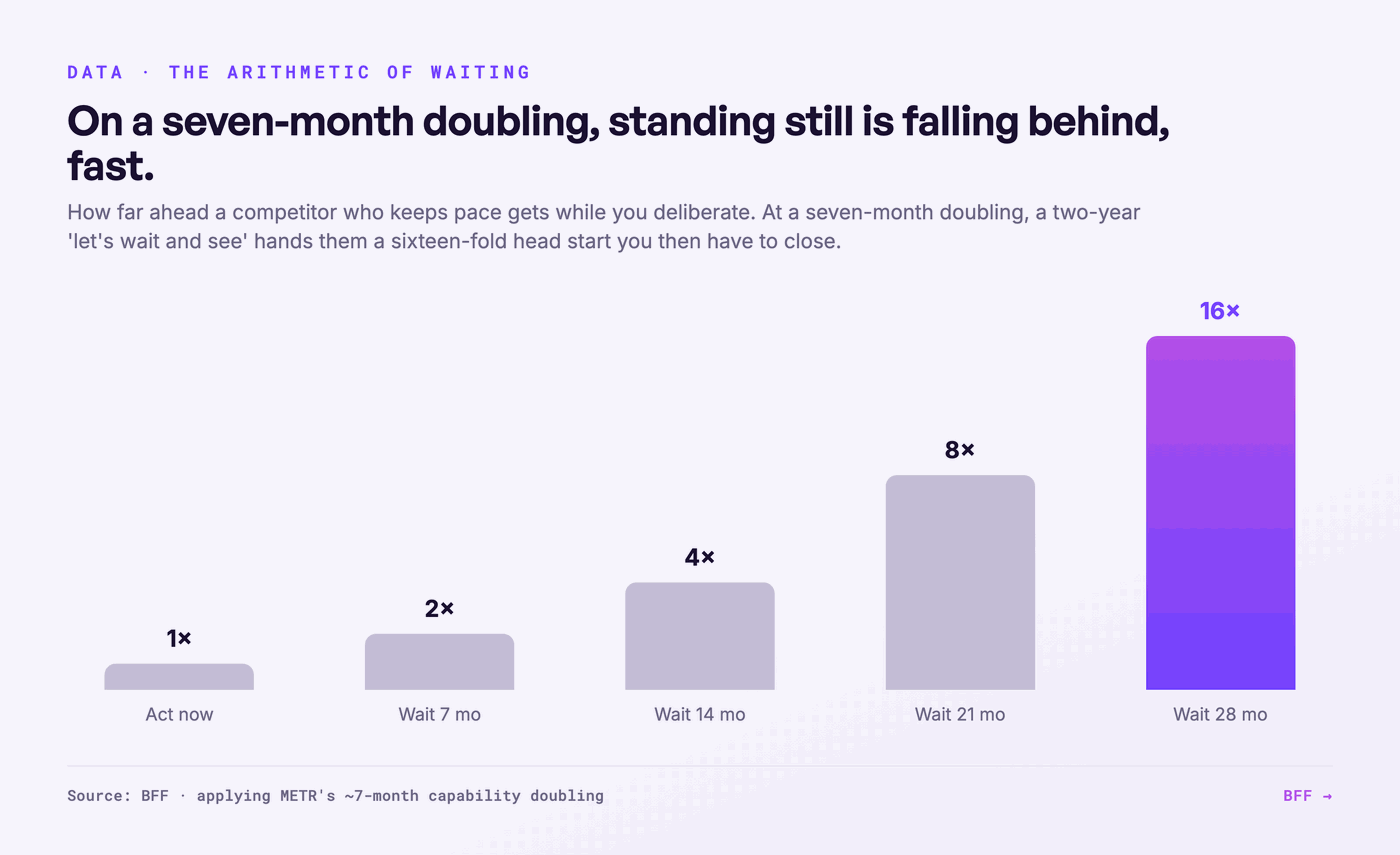
What is new is that the cost of waiting can now be written down as arithmetic. On a seven-month doubling, a competitor who keeps pace is twice as far along in seven months, four times in fourteen, sixteen times in twenty-eight. A two-year wait-and-see hands a rival a sixteen-fold head start that you then have to close against the same clock.
And the spread between movers and waiters is no longer hypothetical. PwC's 2025 analysis of close to a billion job ads found that since 2022, revenue per employee in the industries most exposed to AI grew 27 percent, three times the roughly 9 percent in the least exposed, and job ads demanding AI skills carried an average wage premium of 56 percent. Those are cross-industry correlations rather than measured causal effects, and exposed industries differ in many ways beyond AI, so we read them as a direction. ChatGPT went from under a million users to roughly a billion weekly users by April 2025, and by the time a shift like that is obvious enough to be uncontroversial the organisation that waited for certainty is many doublings behind, on a clock that keeps halving.
11
10. The 2026-28 window
Put the last six sections together and they point at a specific stretch of calendar. Between now and the end of 2028, the capability curve and the cost curve and the physical build-out and the rulebook all cross thresholds. That is what a window looks like from the inside.
The build-out is physical and scheduled
The compute behind the curves is no longer a lab budget. It is civil engineering. xAI's Colossus 2 crossed the gigawatt line in early 2026, the first coherent AI training cluster to do so, and Epoch AI's tracking shows the largest single-site compute doubling every seven months, with campuses under construction on published completion schedules through 2028.
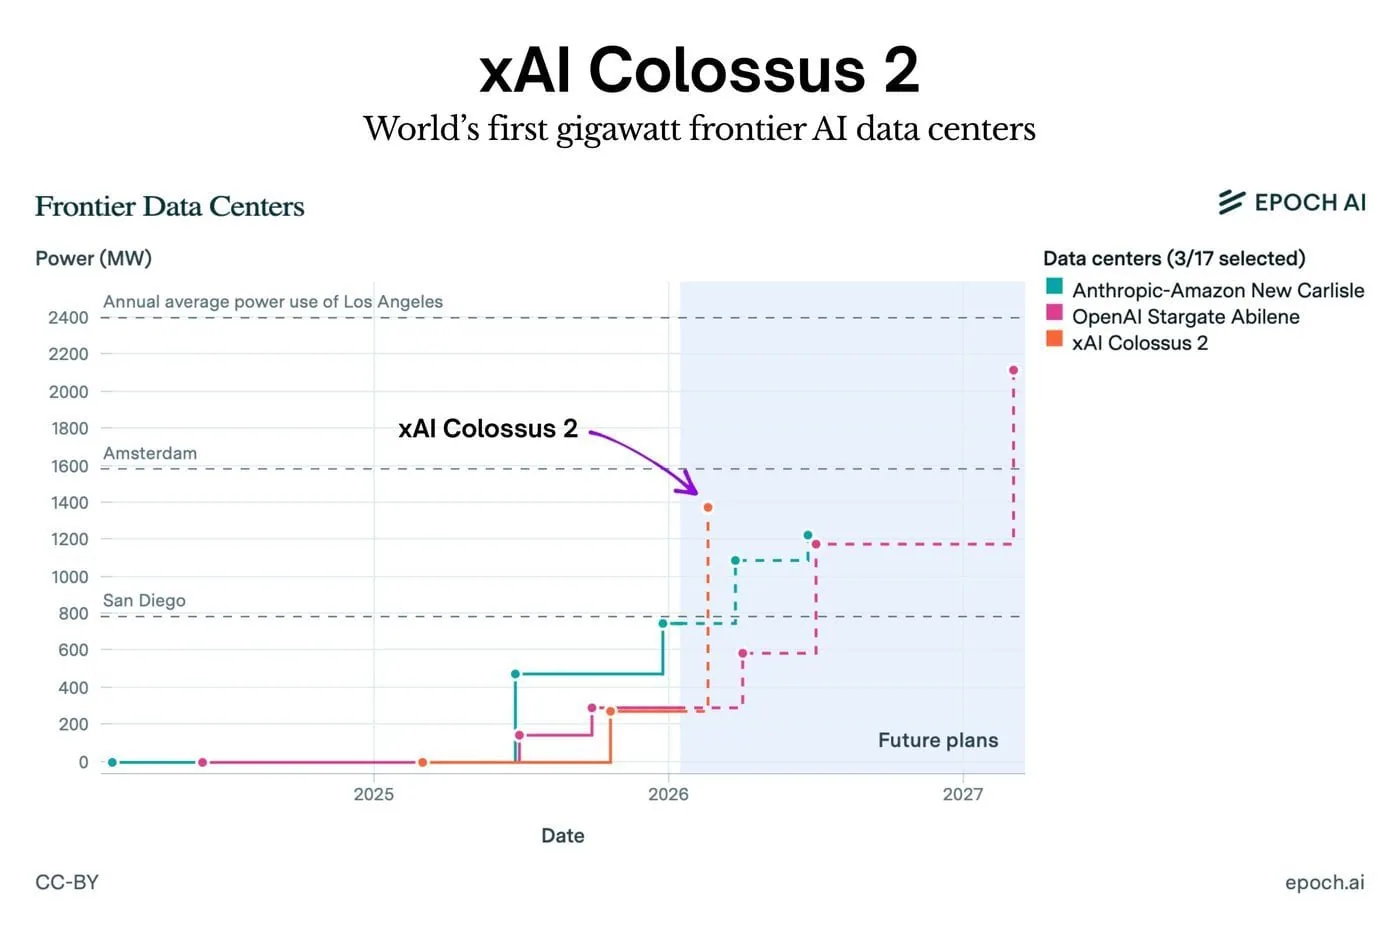
Investment on that scale is not a mood. It is hundreds of billions of dollars of concrete and turbines and grid connections that only pay back if the machines keep improving and keep being used. You do not have to share the investors' confidence. You do have to plan for the capacity existing, because it is being poured either way.
The thresholds are crossing now
Three crossings matter more than the rest. Capability: frontier models passed PhD experts on the hardest science benchmark in 2025 and the task horizon reaches a full working day in 2026, which moves AI from answering questions to carrying work. Cost: at a tenfold annual fall, anything that pencils out marginally today is unambiguous within eighteen months. And expectation: Suleyman's thousand-fold effective-compute projection by end-2028 and Dario Amodei's public position that AI matching human-level breadth is one to three years away are forecasts, and section eleven treats them as such. What they are not is fringe. The people building the systems are all pointing at the same two or three years.
The rulebook has printed dates
Europe's AI Act turns the window into a compliance calendar. Obligations for general-purpose models have applied since August 2025. Transparency marking for synthetic content lands through 2026. High-risk obligations, after the Digital Omnibus postponement, land in December 2027 for stand-alone systems and August 2028 for AI embedded in regulated products. Whatever an organisation decides about adoption, the regulatory work is scheduled for exactly the same window, which means the firms that learn the technology first also write their compliance from experience rather than from theory.
12
11. The honest counter-case
If the argument stopped here it would be hype, and hype is its own way of misreading the curve. Every real exponential is the front half of an S-curve, and the honest question is always how far the top is.
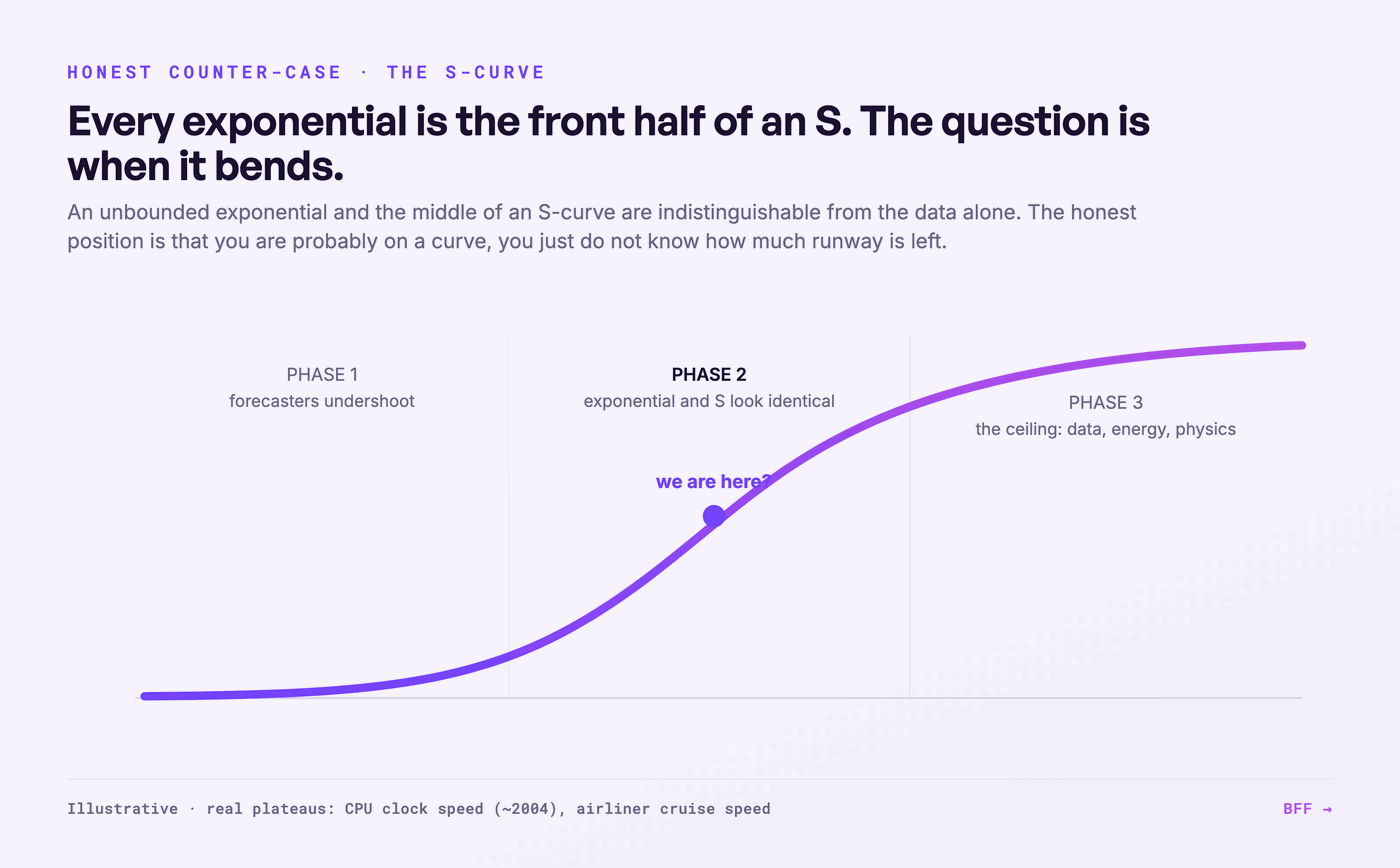
No physical exponential runs forever. It runs until it hits a limit and then it bends. The cleanest example sits inside computing itself: processor clock speeds climbed steeply for decades, then flattened around four gigahertz in 2006 and have barely moved since, because the physics of heat stopped cooperating. Passenger aircraft got faster every decade until the 1970s and then stopped, so a flight today is no quicker than one in 1975 and Concorde, the fastest, was retired. The exponential you are riding always looks endless from the middle and obvious as an S-curve from the far side.
Artificial intelligence has its own limits coming into view, and they are worth naming plainly rather than waving away. Ilya Sutskever, one of the field's founders, told a room of researchers in late 2024 that data is the fossil fuel of AI, and that the supply of human text to train on is finite: "we have but one internet." Analysts estimate the useful stock of public text could be largely consumed within this decade. Chips have their own version of the wall, since the cost to make a transistor stopped falling around 2011 even as the count kept rising. Energy is the newest wall, and the build-out in section ten is precisely the attempt to outrun it.
There is a subtler trap in the charts themselves. The famous scaling curves plot falling prediction error against rising compute, but error is not the same as usefulness, and the input axis is logarithmic, which flatters the trend. A straight line of falling loss does not convert cleanly into a straight line of business value, and I think that gap is underdiscussed.
One quote is worth handling carefully, because it is easy to misuse. Dario Amodei, who runs one of the leading AI labs, said in early 2026 that we are near the end of the exponential. It sounds like surrender and it is the opposite: he means the capability climb is nearly complete, that human-level performance across most cognitive tasks is close, rather than that scaling has failed. The genuinely honest caveat inside his argument is narrower and more useful. The older scaling laws, the ones with a decade of public data behind them, described the pre-training era, and the newer gains come from a different technique that does not yet have a published curve. Some of today's confidence rests on a line that has not actually been drawn.
13
12. The jagged frontier
There is one refinement more honest than either the hype or the scepticism, and it explains why the same tool can look brilliant and useless in the same afternoon.
The aggregate curve is smooth. Capability at the level of a specific task is not. AI has what researchers call a jagged frontier: some tasks fall inside it and get done superbly, others fall just outside it and get done badly, and the two can look identical from the outside. A 2023 Harvard and Boston Consulting Group field experiment put 758 consultants to the test. On tasks inside the frontier, the ones using AI completed 12.2 percent more work at roughly 40 percent higher quality in about 25 percent less time. On tasks outside it, the consultants using AI were 19 percentage points more likely to get the answer wrong.
The line quoted from the study is the one I remember: tasks of similar difficulty to a human can fall on opposite sides of the frontier. Human difficulty is not the right axis. A task that feels hard to us can sit safely inside the frontier, and a task that feels trivial can sit just outside it, and there is no reliable way to guess which from intuition alone.
The frontier is also moving outward as models scale, so today's map is wrong by next quarter. This is how you reconcile "it is exponential" with "but it failed at the thing I asked." Both are true. You cannot read a single task off the aggregate trend line, so you test where the frontier sits for your specific task, build on the inside of it, and then re-test, because the border you charted this month has moved by the next.
14
13. Living on someone else's exponential
For a European reader there is a harder question underneath all of this. Most of the frontier compute curve is being run somewhere else, and that changes what holding the curve means.
The scale of the gap is documented. Mario Draghi's 2024 competitiveness review for the European Commission found that the United States produced 40 notable AI models in 2024 against Europe's 3 and China's 15, that only about 13.5 percent of EU firms had adopted AI at all, and that closing the broader investment gap needs on the order of 800 billion euro a year in additional spending. On the frontier-model curve specifically, Europe is a spectator with a good view.
That is the real picture and it is not the whole picture, because not every exponential is owned by a single lab or a single country. Two of them are ridable from anywhere. Solar is a global learning curve, and Swanson's Law does not care which flag is on the factory, because the price falls for everyone who installs. Open scientific tooling is the other: AlphaFold is free, it is hosted in Europe at EMBL-EBI, and it is already used by more than two million researchers across 190 countries, so a European lab gets the thousand-fold jump from section seven at no charge.
The strategic reading follows from which curve you are standing on. On the frontier-lab curve, inventing first is the only way to lead, and that race has a small field. On the adoption curves, solar and open scientific tooling among them, you win by moving fast on what already exists. For most European organisations the ridable curve is the second kind, and the competitive edge there is speed of adoption rather than originality of invention. Note what that does to the window in section ten: for an adopter, the window is not a race against OpenAI. It is a race against the other firms in your own market, most of which, per Draghi's 13.5 percent, have not started.
15
14. How to hold a curve
The skill worth having sits between two failures. One is the linear reflex that dismisses the curve. The other is the hype that extrapolates it to infinity. Holding both at once is the whole discipline.
Dismissing the curve is the more common and more expensive mistake, and it has a track record forty years long. When a technology is doubling on a short clock, the version of it that looks like a toy today is genuinely the worst it will ever be, and the honest planning assumption is that it improves faster than feels reasonable. Most people, and most organisations, are still anchored to where a capability was when they last looked, which for anything moving on a six-month doubling is already two or three doublings out of date.
Believing the curve is infinite is the rarer mistake, and it is a real one, which is why this dossier spent a full section on limits and another on the jagged frontier. The move is not to pick a side between the boosters and the sceptics. It is to ask better questions. What exactly is doubling, and is it the thing that matters or a proxy for it? Where is the ceiling, and is it physical or economic? Is the growth in the input, like compute, or in the output, like value delivered, because those two can diverge for a long time? And which curve are you actually standing on, the one you have to invent or the one you can adopt?
For a business the practical version is almost boringly concrete. Plan on the assumption that anything on a short doubling clock will be several times more capable and several times cheaper by the time your project ships than it is the day you scope it. Build for the capability arriving rather than the one in the demo. Test where the frontier sits for your own tasks, then re-test as it moves. Watch for the bend, because the S-curve is real and the top is where fortunes are lost by the people who forgot it was coming.
The bias runs one way for almost everyone, toward the straight line, so the correction runs the other way. When a technology looks like it is growing slowly, look again at the clock. The curve you cannot feel is usually the one that matters most, and for the next thirty months it has a name and a date on it.
16
15. Verification and sources
This dossier draws on live web research and a personal archive of more than 15,000 sources. Load-bearing numbers were cross-checked against at least two sources where possible. The notes below flag confidence and the main caveats, in the spirit of showing our work.
| Claim | Confidence | Note |
|---|---|---|
| Exponential underestimation is a measured bias | High | Wagenaar & Sagaria 1975; Stango & Zinman, Journal of Finance 2009; PNAS 2020 (COVID study). |
| McKinsey/AT&T 1980: ~900k forecast vs ~109M actual | Medium-high | Widely cited across sources; the original study is not public. |
| Solar ~$101/W (1976) → ~$0.11/W (2024); ~20-23% per doubling | High | Swanson's Law; pv-magazine; Exponential View. |
| Battery packs $1,474 → $108/kWh, 2010-2025 | High | BloombergNEF, December 2025, real 2025 dollars. |
| Genome $95M (2001) → ~$525-600 (2022-25), outran Moore after 2008 | High | NHGRI sequencing-cost data. |
| Training compute doubles ~6 months; algorithmic efficiency halves ~8 months | High | Epoch AI trend reports 2024-25. |
| Task horizon: seconds (2019) → ~16 hours (2026), ~7-month doubling, ~100 days on 2024-26 models | Medium-high | METR time-horizon research; the tightened doubling is recent and could revert. |
| Fixed-quality token cost fell ~280x in 2 years | Medium-high | Stanford AI Index 2025, anchored to a GPT-3.5 quality level; other anchors give different multiples, same direction. |
| GPQA Diamond: GPT-4 ~30% → o3 87.7% vs PhD experts ~65% | High | Published benchmark results, 2023-25. |
| Largest single data-centre compute doubles ~7 months; Colossus 2 first gigawatt cluster | High | Epoch AI Frontier Data Centers hub, 2025-26. |
| ~1,000x effective compute by end-2028 | Forecast | Mustafa Suleyman, "The Exponential Compute Ramp," April 2026. A projection, not a measurement. |
| Amodei "near the end of the exponential" = bullish reading | High | His own framing: capability climb nearly complete, human-level breadth within one to three years. A stated belief, flagged as such. |
| AI-exposed industries: revenue per employee +27% vs +9%; 56% wage premium | High | PwC Global AI Jobs Barometer 2025, ~1 billion job ads analysed. Cross-industry correlation, not a measured causal effect. |
| Draghi: 40 vs 3 notable models; 13.5% EU adoption; ~€800B/yr gap | High | Draghi competitiveness review, September 2024. |
| EU AI Act dates (GPAI Aug 2025; transparency 2026; high-risk Dec 2027 / Aug 2028) | High | Post-Digital-Omnibus timeline as of mid-2026; the Omnibus moved the original high-risk dates. |
| Kodak and Blockbuster case facts | High | Chapter 11 filing Jan 2012; Netflix offer 2000 per Marc Randolph's account. |
Photographs and video stills in this dossier are frames from publicly posted footage, credited to the original account in each caption. On the web edition these can be replaced with the live posts. Charts labelled "BFF" are our own, drawn from the sources named beneath them. The Epoch AI chart is reproduced under its CC-BY licence.
Dossier as pdf
Download this dossier
The full dossier as a pdf, with every figure and the source list. Fill in your details and the download starts right away.

Ruben Horbach
Co-founder · Back From the Future
Ruben researches how organisations adopt AI meaningfully — not as technology, but as a change in work and people. He builds the agent infrastructure behind BFF and speaks about the near future of work.