
01
Why this, why now
The July edition of this dossier closed with a list of things to watch. The first item told readers to watch global solar additions against the official forecast of a 540 GW plateau, on the reasoning that a year below that flat line would be genuine news.
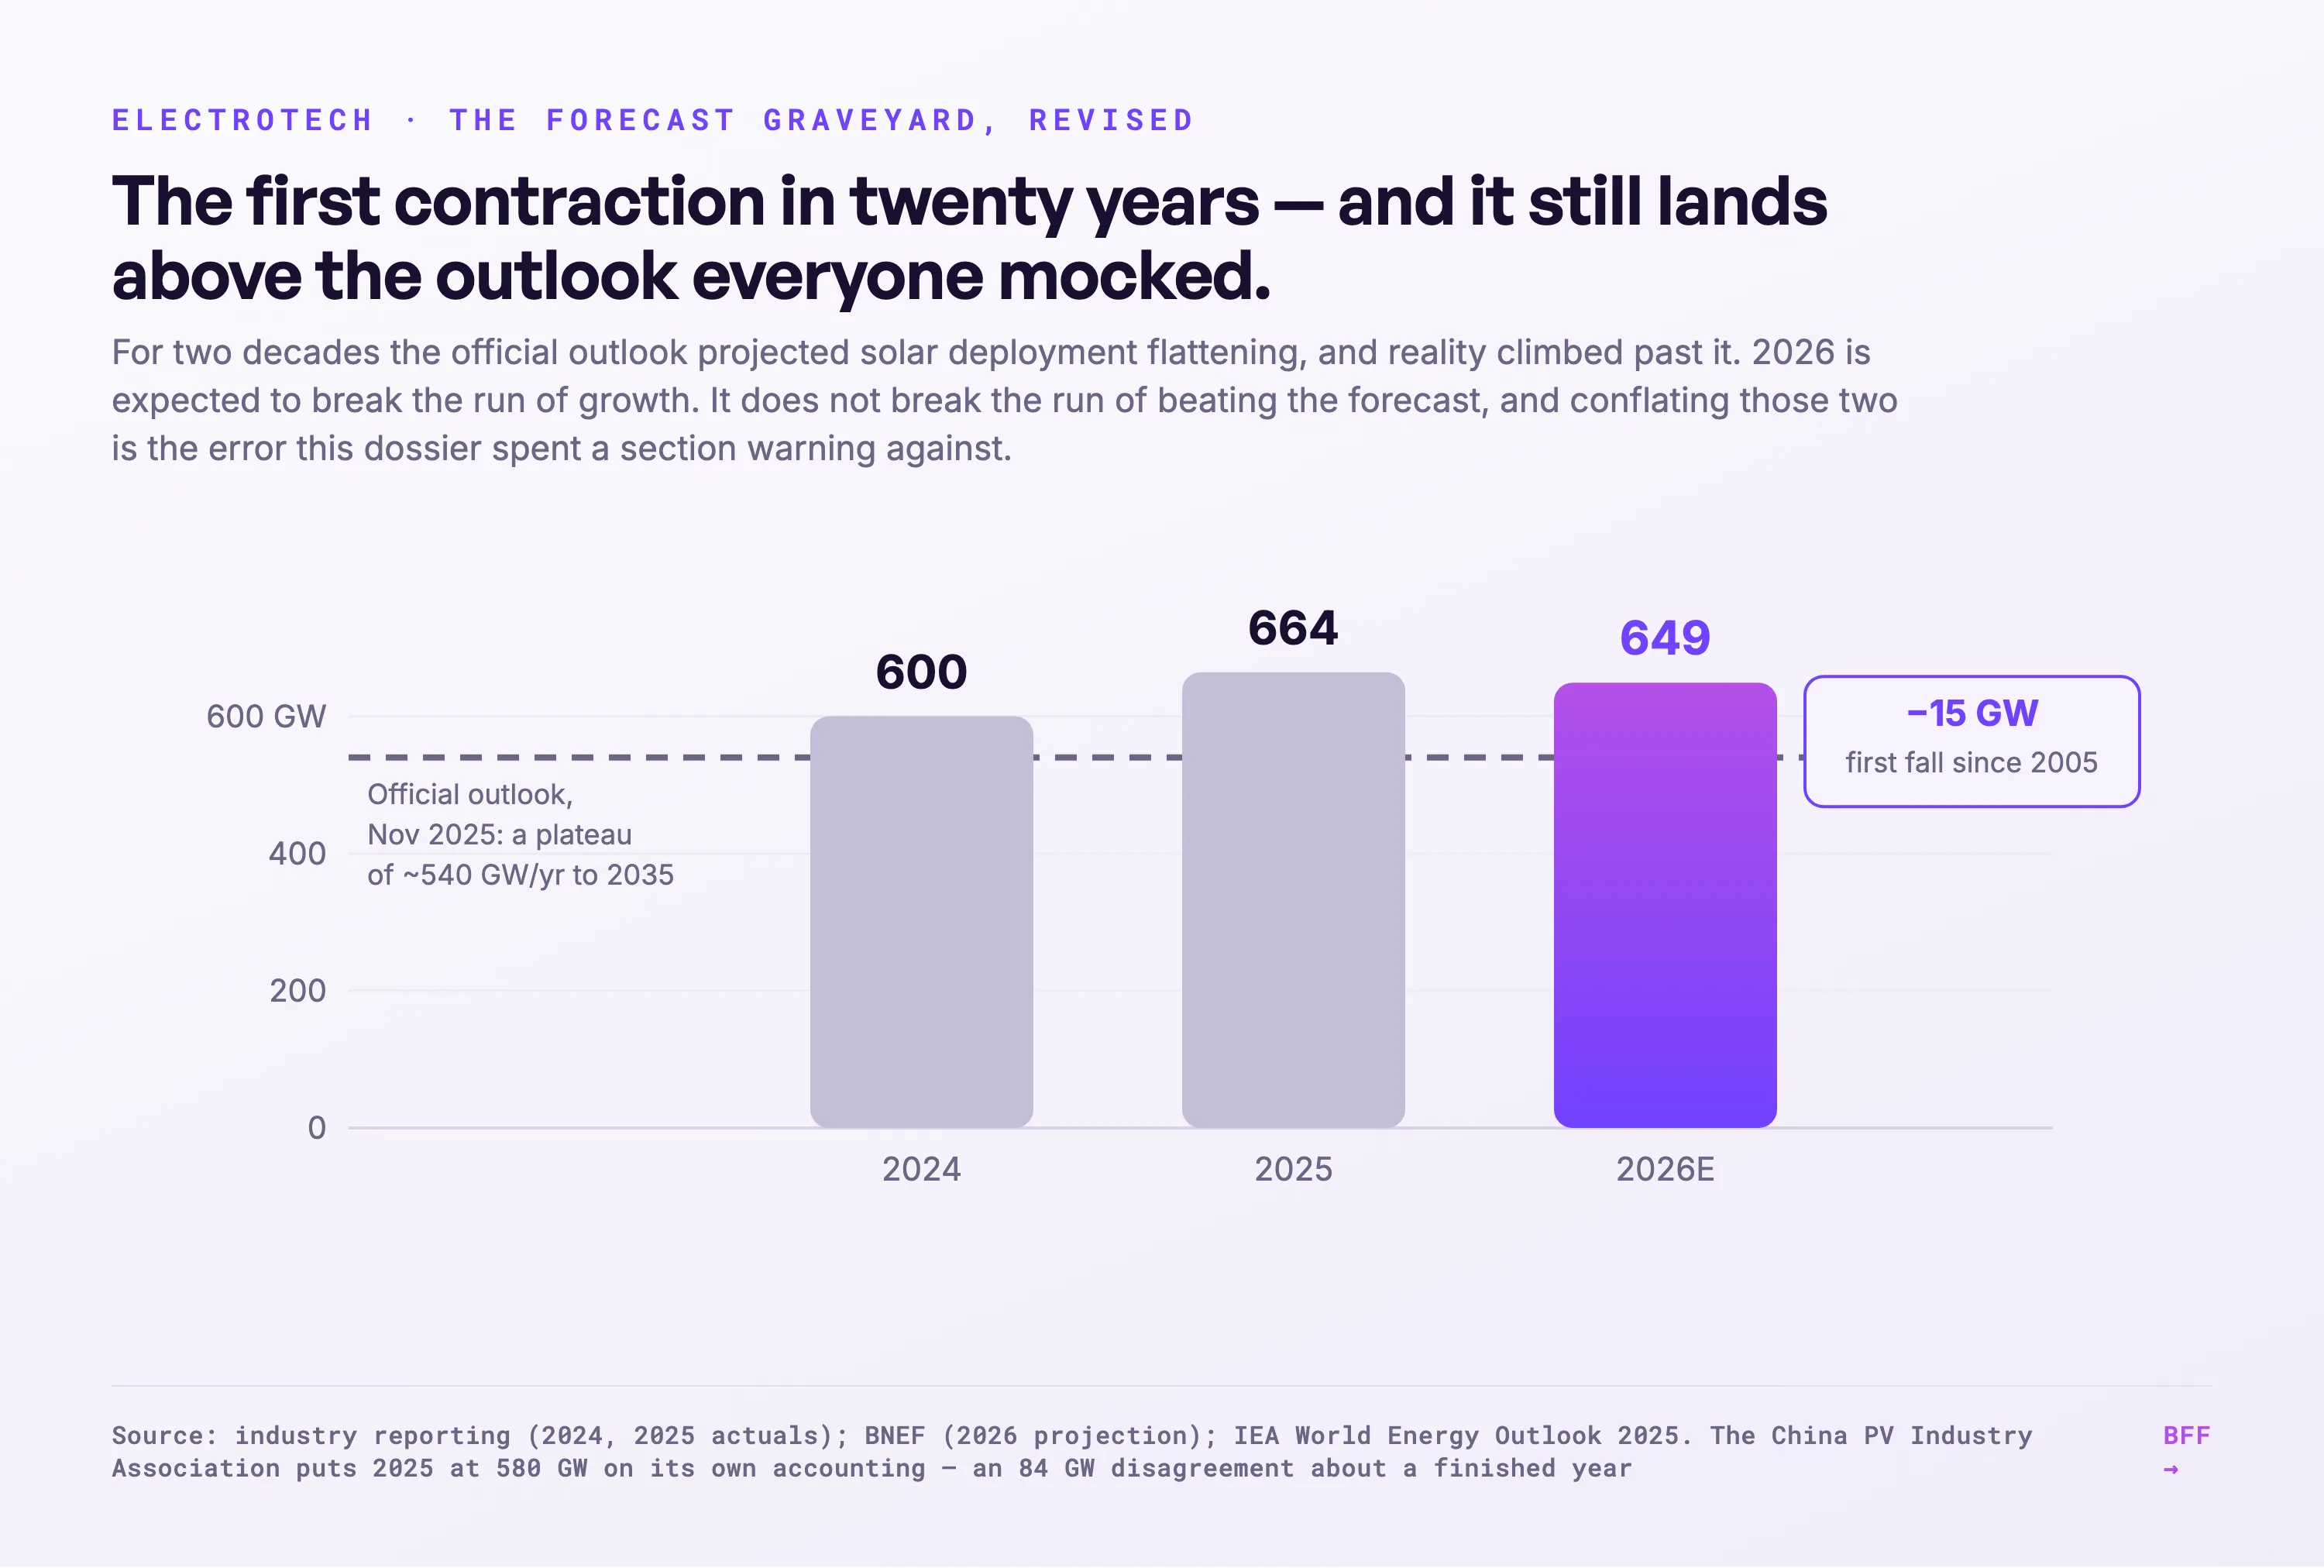
Something did break this year, and it is not that. After a record 664 GW installed globally in 2025, forecasters expect 2026 to be the first annual contraction in solar deployment in more than twenty years, at around 649 GW. That is a fall against 2025 and it is still comfortably above the 540 GW plateau. The run of growth broke. The run of beating the forecast did not, and section 6 is about why we set up a test that could not tell those apart. The cause sits almost entirely in one country. Chinese installations between January and May 2026 came in at 59.59 GW, close to 70 percent below the same months of 2025, following a policy change that moved new solar and wind from the previous support regime to a contract-for-difference system.
A dossier whose most-shared chart mocked an institution for forecasting a plateau owes its readers a careful account of what happens when growth stops anyway. Section 6 is that account, and the short version is that a policy-driven contraction in one market is not the same event as a learning curve breaking, and treating them as the same would be exactly the error we accused the forecasters of, run in reverse.
Everything else in the dossier stands, and some of it is stronger. The Dutch grid queue has hardened into policy. The AI load keeps growing. And the strategic reframe, that power has become equipment rather than infrastructure, is now written into Dutch regulation.
Timeline
- 2024 · The world installs roughly 600 GW of solar in a year, up 32 percent. China ships 46 percent of it.
- Feb 2025 · China announces new solar and wind will move to a contract-for-difference financing system.
- Late 2025 · Colossus 2 approaches the gigawatt line; engineers publish the case for off-grid solar AI datacentres.
- 2025 · Global solar additions hit a record 664 GW. Chinese additions reach 315 GW.
- Dec 2025 · BNEF flags a potential global slowdown in 2026 as China cools.
- Feb 2026 · TenneT warns the grid in Flevoland, Gelderland and Utrecht has reached its absolute limit.
- Jan-May 2026 · Chinese installations fall to 59.59 GW, close to 70 percent down year on year.
- 1 Jul 2026 · Dutch grid congestion reaches households: small consumers join the waiting list.
02
Contents
1. The cheapest energy in history
2. The battery decade
3. The export machine
4. AI eats the grid
5. The forecast graveyard
6. The year the graveyard got a visitor
7. Europe's grid problem, Netherlands close-up
8. Energy as strategy
9. Where we could be wrong
10. What we are watching
11. Verification and sources
03
1. The cheapest energy in history
The foundation fact, established at length in our exponentials dossier and taken as given here: solar fell from $101 per watt in 1976 to about 11 cents in 2024, a decline of roughly 20 to 23 percent for every doubling of cumulative production. That is Swanson's Law, and it is a volume relationship rather than a policy one.
What the energy sequel adds is what the curve did to the market. Solar has been the fastest-growing source of electricity for nineteen consecutive years, and in sunny markets new solar appears to undercut the marginal cost of running existing fossil plants. The consequence arrives in shapes that still look exotic on a European industrial estate: fields that pay for themselves in a handful of years, panels used as fencing because the module has become the cheap part, containerised power stations that unfold like furniture.
When a capability gets cheap enough it stops being infrastructure and starts being equipment. That reframe, power as something a company deploys rather than something it applies for, is the quiet theme we carry through this dossier, and section 7 is where it stops being a metaphor.
04
2. The battery decade
Cheap panels were never the whole answer, because the sun keeps office hours. The 2020s are the decade the storage problem started dissolving at every scale at once.
The cost line first: lithium-ion packs fell from around $1,460 per kilowatt-hour in 2010 to about $108 in 2025, with stationary storage already near $70. On top of that line, 2025 and 2026 stacked capability records with industrial monotony. BYD unveiled the world's largest DC storage block at 14.5 MWh per unit. China connected the world's largest vanadium flow battery, a chemistry built for grid-scale duration rather than for cars. In July 2025 alone, China registered 1,556 new storage projects totalling nearly 140 GWh of pipeline. And peer-reviewed work in Nature Communications estimates that EV batteries alone, cars parked and plugged in, could satisfy short-term grid storage demand as early as 2030.
The strategic meaning of storage differs from that of generation, and we will state it plainly. Cheap panels made electricity cheap at noon. Cheap batteries make it cheap whenever, which converts solar from a supplement into a base, and converts flexibility, when you draw, when you store, when you sell back, into a tradable asset that any company with a roof and a meter can play.
Note that this section's argument is unaffected by everything in section 6. Storage costs are falling on their own curve, and Dutch policy has just made storage the single most privileged thing you can connect to a full grid.
05
3. The export machine
The United States exports intelligence: models, chips, cloud. China exports electrotech: panels, batteries, EVs, the machines of the electric age. That symmetry is the geopolitical frame we think this decade rewards, and our other-AI-race dossier is the other half of it.
China holds a dominant position at every stage of the solar supply chain, comparable positions in battery cells, and controls the refining of the minerals underneath both. In 2024, EVs, batteries, solar and wind products made up a record 47 percent of Chinese exports to the Global South. Ember reports Chinese panels electrifying markets from Pakistan to Nigeria, and its analysts describe China's spare solar capacity as an instrument of energy diplomacy.
Section 6 adds a wrinkle here that cuts in an unexpected direction. Weak domestic Chinese installation in 2026 puts downward pressure on module prices, and manufacturing capacity built for a domestic boom that paused has to go somewhere. For a European buyer, a Chinese demand slump is a buyer's market. The dependency described in this section becomes cheaper and, by exactly the same mechanism, deeper.
For Europe the frame lands uncomfortably. The continent that set the energy transition's rules now imports its hardware from one supplier. The counter-argument, that depending on sunlight-harvesting hardware differs fundamentally from depending on a fuel flow, because the panel keeps working whatever happens to trade, we find genuinely strong, and section 9 gives it full weight.
06
4. AI eats the grid
Just as supply got cheap, demand found its own exponential. The AI build-out is the largest new electricity load of the century, and it negotiates with grids that plan in decades.
Datacentres worldwide draw roughly 500 TWh a year on most estimates, about Germany's total consumption, and the IEA's central projection nearly doubles that by 2030. The frontier sites are the sharpest image: Colossus 2 crossed the gigawatt line in early 2026, one campus drawing more than Amsterdam, and Epoch AI reports the largest single-site compute doubling roughly every seven months with published construction schedules through 2028.
The move we find most interesting is what the AI builders did when the grid said join the queue. They started going around it. Engineers published the off-grid case in December 2025: solar-plus-storage built next to the datacentre, skipping the interconnection queue entirely. Google went the other direction and made its datacentres grid assets, shifting flexible workloads to when power is cheap, which utilities court because a flexible gigawatt stabilises rather than strains. The nuclear revival is the same demand signal wearing different technology.
Every one of these is section 1's lesson applied. When power is equipment, you build it where you need it, and the century-old assumption that load waits politely for the grid is quietly dying.
07
5. The forecast graveyard
For two decades the world's most authoritative energy forecaster has projected solar flattening out, and for two decades reality climbed past the line.
The pattern is well documented. The IEA's World Energy Outlook has projected solar deployment stalling since 2006; researcher Auke Hoekstra made the ritual famous by overlaying each year's flat forecast on the exponential reality, and pv magazine reported in April 2025 that the outlooks systemically underestimate PV. The 2025 edition kept the streak alive with a plateau of roughly 540 GW a year through 2035, a ceiling below what the world had already installed in 2024. The agency's most ambitious 2022 scenario peaked at 657 GW a year, in 2040, and the world passed that in 2025.
Why does an institution full of serious people keep missing the same curve in the same direction? Our reading is that it models energy as policy and projects, while Swanson's Law runs on volume and price. A technology that gets 20 percent cheaper with every doubling behaves like electronics, and the IEA's methods were built for fuels.
All of that remains true. What follows is what happens when the plateau finally shows up anyway.
08
6. The year the graveyard got a visitor
Here is the update, and it is uncomfortable enough to deserve its own section.
Global solar additions reached a record 664 GW in 2025. For 2026, BNEF projects 649 GW, a decline of about 6 GW, and several forecasters expect the first annual contraction in more than twenty years.
I spent longer than I expected trying to establish what the 2025 number actually was, and the answer is instructive enough to keep in the body rather than bury in the appendix. Industry reporting puts 2025 at 664 GW. The China Photovoltaic Industry Association, working from its own accounting, puts the same year at 580 GW. I went looking for a third source to break the tie and did not find one that was independent of the first two. That is a gap of 84 GW between two credible sources describing a year that has already finished, which is larger than the entire annual solar market of any country except China, and larger than the decline everyone is now discussing. The association then forecasts a 2026 range of 500 to 667 GW, a band wide enough to contain both a sharp contraction and a modest record.
None of that is scandalous. It reflects genuine differences in what counts: alternating-current against direct-current capacity, grid connection against installation, calendar-year against reporting-year, and how much rooftop capacity a country's statistics capture at all. It does mean that a reader should treat "solar deployment fell in 2026" as a claim about a direction that several forecasters agree on, and not as a measurement. We would hold the exact figures loosely, and the direction more firmly, and we would note that this dossier is being published while the year in question is still running.
The cause is concentrated and identifiable. Chinese installations from January to May 2026 came in at 59.59 GW, close to 70 percent below the same period a year earlier. The association estimates 180 to 240 GW for China across 2026, against a record 315 GW in 2025, a fall of 24 to 43 percent. The trigger was announced in February 2025: new solar and wind projects moved from the previous support regime to a contract-for-difference system, and deployment responded the way deployment responds to a change in how projects get paid.
Outside China the picture is different. Non-Chinese installations are expected to reach around 308 GW in 2026 and continue growing, with India and Africa accelerating while Europe and the United States soften.
So here is the sentence I would stand behind, and that we will publish under our own name. Global solar deployment is contracting in 2026 for the first time in twenty years, and it is contracting because one country changed its subsidy mechanism, not because the technology got more expensive or demand for electricity fell.
What this refutes. Naive extrapolation of the deployment curve. Anyone who drew a line through global annual installations and projected it forward, including anyone reading our July edition that way, was extrapolating a series that is a policy artefact as much as a technology one. Deployment is not a physical constant. It is an investment decision taken under a regime that governments can change, and one did.
What this does not refute. Swanson's Law, which is a relationship between cumulative production and unit cost, not between calendar years and annual additions. Module prices are still falling; weak Chinese installation is in fact pushing them down further, because the manufacturing capacity did not disappear when the domestic demand paused. A learning curve is refuted by costs stopping their decline, and that has not happened.
And here is the part that requires actual honesty. Our July edition invited readers to treat a dip below the flat line as news that would embarrass the forecaster. It arrived, and it embarrasses us at least as much, because the IEA's plateau and the 2026 contraction have almost nothing to do with each other. The agency forecast a plateau for structural reasons and got a contraction for policy reasons, which is being right by coincidence, and we set up a test that would have scored that as a win for their method. That was a badly designed test. The better test is whether module costs keep falling with cumulative volume, and by that test the curve is intact.
It is a lesson we keep relearning from both directions. An exponential in a technology does not guarantee an exponential in its deployment, because deployment runs through politics, permits, capital and queues. Section 7 is what that looks like when the queue is in Brabant.
09
7. Europe's grid problem, Netherlands close-up
Everything above runs on one assumption: that you can plug in. In the Netherlands in 2026 that assumption fails for fifteen thousand companies at a time, and this year it stopped being only a business problem.
Roughly 15,000 large consumers are queued for a new or heavier connection. Average waits ran to 45 weeks for a new small connection in 2025. TenneT warned in February 2026 that the grid in Flevoland, Gelderland and Utrecht had reached its absolute limit. From 1 July 2026, congested regions extended the waiting list to households and small businesses, which as far as we can establish is a first for a developed economy, and around Eindhoven and Utrecht every new application now waits.
The money is correspondingly large and has been revised upward. Network operators must invest about €235 billion in energy infrastructure between 2026 and 2040, with electricity networks alone requiring roughly €32 billion more than previously budgeted. TenneT and the regional operators are investing over €100 billion to 2030, and operators report that first real relief arrives around 2027 to 2028, with some regions closed to large new connections until 2030 to 2032.
Two developments this year turn this from a complaint into a strategy, and both deserve more attention than they got.
First, priority on a full grid is now allocated rather than queued. From 2026, solutions that relieve the grid, large batteries and flexible generation among them, sit in a priority group. A company that arrives at a full substation asking to consume waits. A company that arrives offering to store or to shift can be treated differently. That is a regulator writing section 1's reframe into law: power is equipment, and the equipment that helps gets in first.
Second, flexibility now has a market with real money behind it. From 2026 there are at least four regional flexibility tenders where businesses can be paid to offer flexibility for regional congestion, and network operators have budget to buy it, with a target of at least €500 million in additional contracts over two years. Add the existing €166 million subsidy scheme funding batteries, smart systems and on-site generation for firms stuck in the queue.
Read those together and the inversion is complete. The government of a rich country is paying its businesses to become partly self-supplying and to sell their flexibility back, which is electrotech adoption by another name. The queue is also a hidden tax on every other transition: the heat pump, the electric fleet, the new production line and the AI ambition all arrive at the same full substation.
And there is now case law. NOS reported on 29 April 2026 that a court in Arnhem had ruled that TenneT did not have to connect a datacentre near Haarlem whose application dated from 2021, holding that the safety of the network takes priority over the interests of individual customers and that without a signed contract a developer can claim nothing from a promise. The grid there is not scheduled for sufficient reinforcement until between 2033 and 2035. Our is-it-a-bubble dossier uses the same case for a different argument, which is what happens when the constraint is genuinely shared.
10
8. Energy as strategy
For fifty years, energy strategy for a normal company meant negotiating a tariff. We think the collision described here turns it back into a board-level variable, and we would make three moves.
We would treat power as equipment. Panels by the pallet, storage by the container, at prices falling on a known curve. For a Dutch firm in the queue, behind-the-meter solar-plus-battery is often the only capacity expansion available before 2028, and the subsidy scheme exists precisely to fund it.
Sell your flexibility. The grid's scarcity has a price and it pays whoever can shift load. Google rescheduling compute to cheap hours is the famous version; charging the fleet at noon, running cold storage as a battery, bidding demand response into congestion markets are the mundane versions, available now. Since 2026 there are tenders and a priority category, so this has moved from clever to structural. Flexibility is the one energy asset the queue cannot confiscate.
We would put energy literacy in the AI plan. If an organisation's AI roadmap assumes abundant cheap compute forever, note that the hyperscalers themselves are hedging with gigawatt solar farms and nuclear contracts. Energy cost and grid access are becoming inputs to digital strategy, a sentence that would have sounded absurd at a Dutch board table in 2020.
One addition this quarter, from section 6. If a procurement decision was built on module prices continuing to fall, that assumption survives. If it was built on installation capacity continuing to expand every year, it does not, and we would use 2026 to check which of the two the business case actually rested on.
11
9. Where we could be wrong
A dossier subtitled around electricity as the new oil owes the reader the strongest arguments against its own enthusiasm. There are four, and section 6 has just made the fourth considerably more concrete.
Winter at 52 degrees north. The near-continuous solar result is real for Las Vegas and meaningless for Groningen in January. Dutch solar output collapses in exactly the weeks demand peaks, and bridging a north-European winter on batteries alone remains economically absurd. The realistic Dutch version, as we see it, is a portfolio: solar plus storage plus wind plus interconnection plus, for years yet, gas peakers as insurance. The curve argument survives; the self-sufficiency fantasy does not.
The mineral chokepoint. Swapping a fuel dependency for a hardware dependency still means depending. A trade rupture would not switch Europe's lights off but would stall its build-out for years. The counterweight: hardware, once installed, keeps working through any embargo, which no barrel of oil ever did. Stocks beat flows in a crisis; the transition period is the vulnerability.
The grid is the long pole. Panels deploy in months, transmission takes a decade, and section 7 shows the constraint binding today. It cuts against solar's own growth too: connection queues for new solar parks are as real as for factories. Anyone extrapolating deployment must accept that the next doubling depends on copper, permits and crews, none of which follow Swanson's Law.
Forecast humility cuts both ways, and this year it cut ours. The July edition wrote that exponential extrapolation fails too, eventually, at an S-curve bend nobody calls in advance, and noted that China's pace had cooled in 2025. Six months later the cooling turned into a 70 percent year-on-year fall in the world's largest market. We were right to include the caveat and wrong about how soon it would matter. The defensible claim was always direction and rough magnitude, never a specific year's number, and section 6 is what it costs to hold ourselves to that.
12
10. What we are watching
Whether module prices keep falling. This is the real test of the argument in this dossier, and section 6 explains why it is a better one than annual installations. If costs flatten while cumulative volume keeps rising, the learning curve is genuinely bending and everything here needs rethinking.
Whether the Chinese contraction is one year or a regime. A contract-for-difference system changes project economics rather than abolishing them, and markets usually adjust within a couple of years. If Chinese installations recover in 2027, this was a transition. If they do not, the export dynamics in section 3 change shape.
Non-China deployment. The 308 GW expected outside China in 2026 is the number that says whether the global picture is one country's policy or a broader turn. India and Africa are the places to look.
The Dutch relief dates. Operators promise first easing in 2027 to 2028. Whether those dates hold determines which regional business cases exist this decade, and the Arnhem ruling suggests the courts will not accelerate them.
Whether flexibility markets clear. The tenders and the €500 million target are new. If businesses actually bid and get paid, section 8's second move becomes standard practice quickly. If the tenders undersubscribe, the queue stays the only story.
The off-grid AI experiments. If the first multi-hundred-megawatt solar-native datacentre hits its cost targets, the interconnection queue stops being a moat for incumbents anywhere, including in a logistics park in Brabant.
The closing image is still the collision, and it has sharpened rather than softened. On one side of the world a company unfolds a containerised solar plant in an afternoon, in a market whose installations just fell by two thirds because a subsidy rule changed. On the other, fifteen thousand companies wait for a wire, in a country now paying them to stop needing it. Same technology, same decade, opposite experiences, and the difference is not physics but build-out and politics. Electricity rewards whoever builds fastest, and building fast turns out to depend on things that are not on any cost curve.
13
11. Verification and sources
This dossier draws on live web research and a personal archive of more than 15,000 sources. The notes below flag confidence and the material caveats.
| Claim | Confidence | Note |
|---|---|---|
| Solar $101/W (1976) → ~$0.11/W (2024); Swanson's Law at 20-23% per doubling | High | Verified in our exponentials dossier; Our World in Data and industry price series. A cost-versus-cumulative-volume relationship, which section 6 argues is the claim that matters. |
| Battery packs ~$108/kWh (2025), stationary storage near $70 | High | BNEF survey, verified in the exponentials dossier. |
| World installed ~600 GW of solar in 2024 (+32%) | High | SolarPower Europe 600, IEA Global Energy Review 602, PV Tech 553; methodology differences. |
| Record 664 GW installed globally in 2025 | Medium-high | Industry reporting. Note that the China PV Industry Association's own accounting puts 2025 at 580 GW, a difference of 84 GW between sources for the same year. Where a range is quoted below, this disagreement is why. |
| 2026 expected to be the first annual contraction in global solar deployment in more than 20 years; BNEF projects 649 GW | Medium | Forecasts made in late 2025 and early 2026, not outcomes. Ranges from different bodies run from 500 to 667 GW, which spans both a sharp fall and a modest rise. The claim that 2026 contracts is a consensus of forecasters, not a measurement, and this dossier is published before the year is over. |
| Chinese installations Jan-May 2026 at 59.59 GW, close to 70% below the same period in 2025 | Medium-high | Reported industry data. Partial-year figures are volatile and the comparison base is a record period, both of which exaggerate the percentage. |
| China forecast at 180-240 GW for 2026 against a record 315.07 GW in 2025, a fall of 24-43% | Medium | China PV Industry Association forecast, February 2026. A forecast with a wide band. |
| The trigger was a February 2025 policy change moving new solar and wind to a contract-for-difference system | Medium-high | Announced policy and contemporaneous analysis. The attribution of the fall to this single cause is the consensus reading; other factors including curtailment and grid limits also apply. |
| Non-China installations expected around 308 GW in 2026, still growing, with India and Africa accelerating | Medium | Forecast. |
| Module prices falling further under weak Chinese demand | Medium | Trade-press reporting. Directionally consistent with oversupply; we have not verified a price series for 2026. |
| IEA WEO 2025 projects a ~540 GW/yr plateau to 2035; the 2022 most-ambitious scenario peaked at 657 GW/yr in 2040 | High | Coverage of WEO 2025, November 2025. Section 6 argues that our July framing of this as a test was poorly designed, which is a criticism of us and not of the figure. |
| Datacentres draw ~500 TWh/yr, roughly Germany's consumption; IEA projects nearly double by 2030 | Medium-high | IEA and contemporaneous analysis. Datacentre energy accounting varies widely by boundary definition. |
| Largest single-site compute doubling roughly every seven months, schedules published to 2028 | Medium-high | Epoch AI. |
| ~15,000 Dutch large consumers queued; average 45-week wait for a new small connection in 2025; small consumers join waiting lists from 1 July 2026; Eindhoven and Utrecht regions fully queued | High | Netbeheer Nederland, ACM and national reporting. Situation varies per grid area and changes; check locally. |
| TenneT warned in February 2026 that Flevoland, Gelderland and Utrecht had reached their absolute limit | Medium-high | Contemporaneous reporting. |
| Network operators to invest ~€235 billion 2026-2040, with electricity networks ~€32 billion above prior budget; over €100 billion to 2030; first relief 2027-2028, some regions closed to 2030-2032 | Medium-high | Operator guidance and reporting. Investment plans are commitments, not completions. |
| From 2026, grid-relieving solutions including large batteries have priority access on congested grids; at least four regional flexibility tenders; target of at least €500 million in additional flexibility contracts over two years; existing €166 million subsidy scheme | Medium-high | Dutch government and regulator measures, 2026. Mechanism design was still settling at the time of writing. |
| Arnhem court ruled TenneT need not connect a datacentre near Haarlem; application dated 2021; reinforcement not until 2033-2035 | High | NOS, 29 April 2026. The developer kept an appeal open, so the case was not final. |
| China at 47% of exports to the Global South in EVs, batteries, solar and wind (2024); dominant across the solar supply chain and mineral refining | Medium-high | IEA supply-chain analysis and Ember. |
| EV batteries could satisfy short-term grid storage demand as early as 2030 | Medium | Nature Communications projection; a modelled scenario, not a forecast of deployment. |
Charts labelled "BFF" are our own, drawn from the sources named beneath them. Framed figures are credited to their original sources in their captions.
Dossier as pdf
Download this dossier
The full dossier as a pdf, with every figure and the source list. Fill in your details and the download starts right away.

Ruben Horbach
Co-founder · Back From the Future
Ruben researches how organisations adopt AI meaningfully — not as technology, but as a change in work and people. He builds the agent infrastructure behind BFF and speaks about the near future of work.